Anora Group
4,995 EUR +1,01%5.414 investorer følger denne virksomhed
Anora Group is a producer of alcoholic beverages. The product portfolio consists of wine and spirits marketed under various brands. The largest operations are found in the Nordics and the Baltics, and the company's products are exported to retailers in Europe and North America. The company was created through a merger of Altia and Arcus in 2021 and has its headquarters in Helsinki.
P/E (24e)
11,39
EV/EBIT (adj.) (24e)
8,27
P/B (24e)
0,8
Udbytteafkast, % (24e)
5,01 %
Kursmål
5.50 EUR
Anbefaling
Akkumulér
Opdateret
7.4.2024
NASDAQ Helsinki
ANORA
Daglig lav / høj pris
4,935 / 5,02
EUR
Markedsværdi
337,43 mio. EUR
Aktieomsætning
164,58 t EUR
Volumen
33 t
Risiko og anbefaling
HøjRisikoLav
SælgAnbefalingKøb
Seneste analyser
Extensive report
Inderes' extensive report is an investor's handbook on customer companies covered by our research.
The latest extensive report was released
Read the reportAnalyst

Rauli Juva
Analytiker
Seneste videoer
Finanskalender
Delårsrapport
07.05.2024
Delårsrapport
20.08.2024
Delårsrapport
07.11.2024
Større aktionærerKilde: Millistream Market Data AB
| Ejer | Kapital | Stemmer |
|---|---|---|
| Solidium Oy | 19,4 % | 19,4 % |
| Varma Mutual Pension Insurance Company | 3,0 % | 3,0 % |
Premium
This content is for our Premium customers only.
Insider transaktioner
| Insider | Date | Total value |
|---|---|---|
| Kirsten ægidius | 17.11.2023 | 15.719EUR |
| Annareetta Lumme-timonen | 16.11.2023 | 1.692EUR |
Premium
This content is for our Premium customers only.
Resultatopgørelse
| 2020 | 2021 | 2022 | 2023 | 2024e | 2025e | 2026e | 2027e | |
|---|---|---|---|---|---|---|---|---|
| Omsætning | 342,4 | 665,0 | 702,7 | 727,6 | 724,0 | 743,6 | 758,4 | 773,6 |
| vækst-% | -4,8 % | 94,2 % | 5,7 % | 3,6 % | -0,5 % | 2,7 % | 2,0 % | 2,0 % |
| EBITDA | 40,3 | 95,2 | 67,9 | 68,6 | 81,0 | 86,6 | 90,5 | 92,3 |
| EBIT (adj.) | 35,0 | 69,8 | 42,9 | 35,9 | 53,8 | 59,0 | 63,4 | 65,5 |
| EBIT | 22,9 | 64,0 | 34,7 | -30,2 | 53,8 | 59,0 | 63,4 | 65,5 |
| Overskud før skat | 21,3 | 54,5 | 23,4 | -52,7 | 37,3 | 45,0 | 53,4 | 58,3 |
| Netto indkomst | 17,8 | 42,7 | 17,9 | -39,0 | 29,6 | 35,5 | 42,1 | 46,0 |
| EPS (adj.) | 0,83 | 1,04 | 0,39 | 0,21 | 0,44 | 0,52 | 0,62 | 0,68 |
| vækst-% | 48,7 % | 26,0 % | -62,8 % | -46,8 % | 113,2 % | 19,6 % | 18,7 % | 9,3 % |
| Udbytte | 0,75 | 0,45 | 0,22 | 0,22 | 0,25 | 0,30 | 0,40 | 0,48 |
| Udbytte ratio | 152,7 % | 71,2 % | 82,9 % | -38,2 % | 57,0 % | 57,2 % | 64,3 % | 70,0 % |
Profitability and return on capital
| 2020 | 2021 | 2022 | 2023 | 2024e | 2025e | 2026e | 2027e | |
|---|---|---|---|---|---|---|---|---|
| EBITDA-% | 11,8 % | 14,3 % | 9,7 % | 9,4 % | 11,2 % | 11,6 % | 11,9 % | 11,9 % |
| EBIT-% (adj.) | 10,2 % | 10,5 % | 6,1 % | 4,9 % | 7,4 % | 7,9 % | 8,4 % | 8,5 % |
| EBIT-% | 6,7 % | 9,6 % | 4,9 % | -4,2 % | 7,4 % | 7,9 % | 8,4 % | 8,5 % |
| ROE | 11,5 % | 12,9 % | 3,6 % | -8,8 % | 7,1 % | 8,2 % | 9,3 % | 9,7 % |
| ROI | 9,2 % | 12,1 % | 4,9 % | -3,1 % | 8,0 % | 8,6 % | 9,6 % | 10,3 % |
Værdiansættelse
| 2020 | 2021 | 2022 | 2023 | 2024e | 2025e | 2026e | 2027e | |
|---|---|---|---|---|---|---|---|---|
| Aktiekurs (EUR) | 9,98 | 10,86 | 7,36 | 4,36 | 5,00 | 5,00 | 5,00 | 5,00 |
| Aktier | 36,1 | 67,6 | 67,6 | 67,6 | 67,6 | 67,6 | 67,6 | 67,6 |
| Markedsværdi | 360,7 | 733,6 | 497,5 | 294,7 | 337,7 | 337,7 | 337,7 | 337,7 |
| Enterprise value | 356,9 | 859,7 | 777,3 | 413,2 | 444,8 | 409,3 | 386,6 | 367,2 |
| EV/S | 1,0 | 1,3 | 1,1 | 0,6 | 0,6 | 0,6 | 0,5 | 0,5 |
| EV/EBITDA | 8,9 | 9,0 | 11,4 | 6,0 | 5,5 | 4,7 | 4,3 | 4,0 |
| EV/EBIT (adj.) | 10,2 | 12,3 | 18,1 | 11,5 | 8,3 | 6,9 | 6,1 | 5,6 |
| EV/EBIT | 15,6 | 13,4 | 22,4 | - | 8,3 | 6,9 | 6,1 | 5,6 |
| P/E (adj.) | 12,1 | 10,4 | 19,0 | 21,2 | 11,4 | 9,5 | 8,0 | 7,3 |
| P/E | 20,3 | 11,9 | 27,7 | - | 11,4 | 9,5 | 8,0 | 7,3 |
| P/B | 2,3 | 1,4 | 1,0 | 0,7 | 0,8 | 0,8 | 0,7 | 0,7 |
| P/S | 1,1 | 1,1 | 0,7 | 0,4 | 0,5 | 0,5 | 0,4 | 0,4 |
| Udbytteprocent | 7,5 % | 4,1 % | 3,0 % | 5,1 % | 5,0 % | 6,0 % | 8,0 % | 9,5 % |
| Equity ratio | 34,3 % | 41,2 % | 37,0 % | 36,0 % | 37,2 % | 37,4 % | 41,8 % | 42,5 % |
| Gearing ratio | -2,4 % | 24,8 % | 62,5 % | 33,8 % | 25,3 % | 16,2 % | 10,5 % | 6,1 % |
Kvartalsdata
| Q1/23 | Q2/23 | Q3/23 | Q4/23 | 2023 | Q1/24e | Q2/24e | Q3/24e | Q4/24e | |
|---|---|---|---|---|---|---|---|---|---|
| Omsætning | 159,5 | 182,7 | 173,1 | 212,3 | 727,6 | 156,0 | 178,0 | 175,0 | 215,0 |
| EBITDA | 6,9 | 9,9 | 28,9 | 23,0 | 68,6 | 10,0 | 16,5 | 21,5 | 33,0 |
| EBIT | -1,7 | 1,7 | 20,5 | -50,6 | -30,2 | 3,2 | 9,7 | 14,7 | 26,2 |
| Overskud før skat | -5,9 | -4,7 | 14,4 | -56,5 | -52,7 | -1,0 | 5,2 | 10,7 | 22,4 |
| Netto indkomst | -5,6 | -4,2 | 14,0 | -43,1 | -39,0 | -0,8 | 4,2 | 8,5 | 17,8 |
ViserAlle indholdstyper

Anora AGM | CEO's review 17.4.2024
Decisions taken by Anora's Annual General Meeting 2024 and Anora's Board of Directors
Join Inderes community
Don't miss out - create an account and get all the possible benefits
Inderes account
Followings and notifications on followed companies
Analyst comments and recommendations
Stock comparison tool & other popular tools
Anora: Valuation corrected, outlook still good
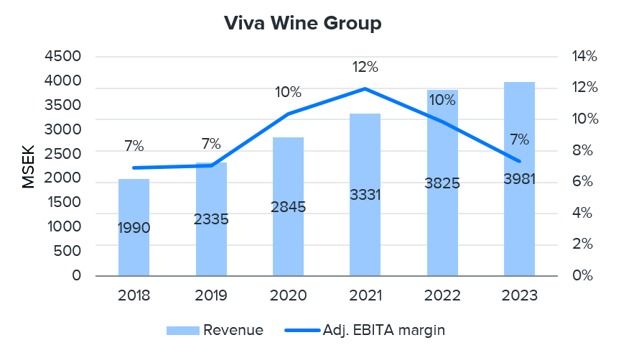
Rival Viva Wine grows and outperforms Anora's Wine segment
Anora's Annual Report and Remuneration Report for 2023 as well as updated Remuneration Policy have been published - Correction to the unaudited figures in the Q4 2023 Financial Statement Release
Anora Group Plc: Notice of the Annual General Meeting 2024
Change in Anora Group's Executive Management Team: Stein Eriksen appointed as CFO of Anora
Anora: Recovery of Wine segment as 2024 earnings driver

Anora Q4’23: Ending the year in a more positive territory

Anora Q4'23 – Wednesday, Feb. 14 at 11:00 am EET
Anora Group's Board of Directors decided on a new plan period within the share-based long-term incentive scheme for the management and selected key employees
Anora Group Plc's Financial Statement Release for 1 January - 31 December 2023
Anora finalised change negotiations to develop its operating model
Publication of Anora's Financial Statement Release for January-December 2023 on 14 February 2024 and invitation to results presentation
Anora: New management focuses on raising profitability
Change in Anora Group's Executive Management Team: Anora's Chief Financial Officer to change
Inside information, profit warning: Anora Group lowers its guidance for 2023