H&M
187,1 SEK +1%3.722 investorer følger denne virksomhed
Hennes & Mauritz is a retail chain. The range consists of clothing, shoes, and accessories. The group also includes brands such as COS, Monki, Weekday, Cheap Monday, and Other Stories. Today, the company also conducts business in home furnishings via H&M Home. The company has a presence in all global regions. H&M was originally founded in 1947 and is headquartered in Stockholm, Sweden.
P/E (24e)
21,24
EV/EBIT (adj.) (24e)
17,08
P/B (24e)
5,88
Udbytteafkast, % (24e)
3,74 %
Kursmål
170.00 SEK
Anbefaling
Reducer
Opdateret
28.3.2024
NASDAQ Stockholm
HM B
Daglig lav / høj pris
184,6 / 187,15
SEK
Markedsværdi
301,33 mia. SEK
Aktieomsætning
183,29 mio. SEK
Volumen
979 t
Risiko og anbefaling
HøjRisikoLav
SælgAnbefalingKøb
Seneste analyser
Extensive report
Inderes' extensive report is an investor's handbook on customer companies covered by our research.
The latest extensive report was released
Read the reportAnalyst

Rauli Juva
Analytiker
Finanskalender
Delårsrapport
27.06.2024
Delårsrapport
26.09.2024
Halvårligt udbytte
07.11.2024
Årsrapport
30.01.2025
Større aktionærerKilde: Millistream Market Data AB
| Ejer | Kapital | Stemmer |
|---|---|---|
| Stefan Persson and family | 58,7 % | 80,5 % |
| Lottie Tham | 5,4 % | 2,6 % |
Premium
This content is for our Premium customers only.
Resultatopgørelse
| 2020 | 2021 | 2022 | 2023 | 2024e | 2025e | 2026e | 2027e | |
|---|---|---|---|---|---|---|---|---|
| Omsætning | 187.031,0 | 198.967,0 | 223.553,0 | 236.035,0 | 237.069,0 | 247.555,0 | 259.558,0 | 272.536,0 |
| vækst-% | -19,6 % | 6,4 % | 12,4 % | 5,6 % | 0,4 % | 4,4 % | 4,8 % | 5,0 % |
| EBITDA | 29.052,0 | 37.575,0 | 29.748,0 | 37.492,0 | 42.640,4 | 46.434,8 | 47.590,6 | 48.870,7 |
| EBIT (adj.) | 3.099,0 | 15.255,0 | 9.760,0 | 13.538,0 | 20.737,4 | 23.718,9 | 24.822,6 | 25.890,9 |
| EBIT | 3.099,0 | 15.255,0 | 7.169,0 | 14.537,0 | 20.737,4 | 23.718,9 | 24.822,6 | 25.890,9 |
| Overskud før skat | 2.052,0 | 14.300,0 | 6.216,0 | 13.010,0 | 18.916,4 | 22.218,9 | 23.622,6 | 25.390,9 |
| Netto indkomst | 1.243,0 | 11.010,0 | 3.566,0 | 8.723,0 | 14.183,8 | 16.775,3 | 17.835,0 | 19.170,1 |
| EPS (adj.) | 0,75 | 6,65 | 3,74 | 4,73 | 8,81 | 10,42 | 11,07 | 11,90 |
| vækst-% | -90,8 % | 785,8 % | -43,8 % | 26,4 % | 86,3 % | 18,3 % | 6,3 % | 7,5 % |
| Udbytte | 0,00 | 6,50 | 6,50 | 6,50 | 7,00 | 7,50 | 8,50 | 11,90 |
| Udbytte ratio | 97,7 % | 299,8 % | 120,9 % | 79,5 % | 72,0 % | 76,8 % | 100,0 % |
Profitability and return on capital
| 2020 | 2021 | 2022 | 2023 | 2024e | 2025e | 2026e | 2027e | |
|---|---|---|---|---|---|---|---|---|
| EBITDA-% | 15,5 % | 18,9 % | 13,3 % | 15,9 % | 18,0 % | 18,8 % | 18,3 % | 17,9 % |
| EBIT-% (adj.) | 1,7 % | 7,7 % | 4,4 % | 5,7 % | 8,7 % | 9,6 % | 9,6 % | 9,5 % |
| EBIT-% | 1,7 % | 7,7 % | 3,2 % | 6,2 % | 8,7 % | 9,6 % | 9,6 % | 9,5 % |
| ROE | 2,2 % | 19,2 % | 6,4 % | 17,7 % | 28,7 % | 31,1 % | 29,9 % | 29,4 % |
| ROI | 3,0 % | 11,7 % | 5,7 % | 11,7 % | 16,5 % | 18,7 % | 19,6 % | 20,2 % |
Værdiansættelse
| 2020 | 2021 | 2022 | 2023 | 2024e | 2025e | 2026e | 2027e | |
|---|---|---|---|---|---|---|---|---|
| Aktiekurs (SEK) | 172,00 | 178,08 | 112,24 | 176,62 | 187,10 | 187,10 | 187,10 | 187,10 |
| Aktier | 1.655,1 | 1.655,1 | 1.645,0 | 1.622,0 | 1.610,5 | 1.610,5 | 1.610,5 | 1.610,5 |
| Markedsværdi | 284.672,0 | 294.734,9 | 184.634,8 | 286.477,6 | 301.324,6 | 301.324,6 | 301.324,6 | 301.324,6 |
| Enterprise value | 348.197,0 | 333.954,9 | 235.562,8 | 338.049,6 | 354.185,1 | 352.383,0 | 351.214,1 | 350.997,4 |
| EV/S | 1,9 | 1,7 | 1,1 | 1,4 | 1,5 | 1,4 | 1,4 | 1,3 |
| EV/EBITDA | 12,0 | 8,9 | 7,9 | 9,0 | 8,3 | 7,6 | 7,4 | 7,2 |
| EV/EBIT (adj.) | 112,4 | 21,9 | 24,1 | 25,0 | 17,1 | 14,9 | 14,1 | 13,6 |
| EV/EBIT | 112,4 | 21,9 | 32,9 | 23,3 | 17,1 | 14,9 | 14,1 | 13,6 |
| P/E (adj.) | 229,0 | 26,8 | 30,0 | 37,4 | 21,2 | 18,0 | 16,9 | 15,7 |
| P/E | 229,0 | 26,8 | 51,8 | 33,1 | 21,2 | 18,0 | 16,9 | 15,7 |
| P/B | 5,2 | 4,9 | 3,6 | 6,0 | 5,9 | 5,3 | 4,8 | 4,4 |
| P/S | 1,5 | 1,5 | 0,8 | 1,2 | 1,3 | 1,2 | 1,2 | 1,1 |
| Udbytteprocent | 3,7 % | 5,8 % | 3,7 % | 3,7 % | 4,0 % | 4,5 % | 6,4 % | |
| Equity ratio | 31,3 % | 33,4 % | 27,9 % | 26,3 % | 28,7 % | 31,2 % | 34,6 % | 36,2 % |
| Gearing ratio | 116,3 % | 65,3 % | 100,3 % | 108,3 % | 103,2 % | 90,0 % | 79,8 % | 73,1 % |
Kvartalsdata
| Q1/23 | Q2/23 | Q3/23 | Q4/23 | 2023 | Q1/24e | Q2/24e | Q3/24e | Q4/24e | |
|---|---|---|---|---|---|---|---|---|---|
| Omsætning | 54.872,0 | 57.616,0 | 60.897,0 | 62.650,0 | 236.035,0 | 53.669,0 | 58.000,0 | 61.500,0 | 63.900,0 |
| EBITDA | 6.230,0 | 10.234,0 | 10.466,0 | 10.562,0 | 37.492,0 | 7.480,0 | 11.530,0 | 12.080,0 | 11.550,4 |
| EBIT | 725,0 | 4.741,0 | 4.739,0 | 4.332,0 | 14.537,0 | 2.077,0 | 6.030,0 | 6.580,0 | 6.050,4 |
| Overskud før skat | 396,0 | 4.325,0 | 4.373,0 | 3.916,0 | 13.010,0 | 1.606,0 | 5.580,0 | 6.130,0 | 5.600,4 |
| Netto indkomst | 540,0 | 3.288,0 | 3.319,0 | 1.576,0 | 8.723,0 | 1.201,0 | 4.185,0 | 4.597,5 | 4.200,3 |
ViserAlle indholdstyper

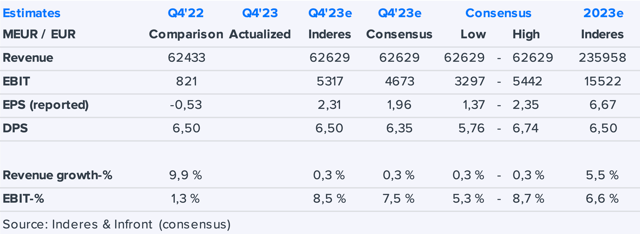
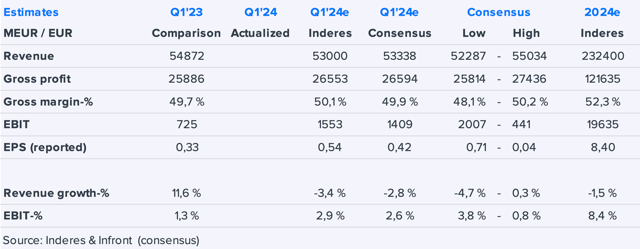
Gross margin improved faster than expected
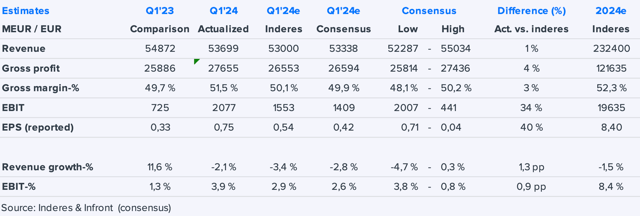
H&M Q1: Ahead of expectations thanks to strong gross margin
Join Inderes community
Don't miss out - create an account and get all the possible benefits
Inderes account
Followings and notifications on followed companies
Analyst comments and recommendations
Stock comparison tool & other popular tools
H & M Hennes & Mauritz AB: H&M's nomination committee proposes Helena Saxon as new board member
H & M Hennes & Mauritz AB: NOTICE OF ANNUAL GENERAL MEETING
H & M Hennes & Mauritz AB's Annual and Sustainability Report 2023 is published
H & M Hennes & Mauritz AB Three-month report
H&M Q1 on Wednesday: Negative revenue growth but clearly higher margin expected
H & M Hennes & Mauritz AB: Buybacks of shares by H&M during week 9, 2024. The share buyback programme is now complete and has been closed.
H & M Hennes & Mauritz AB: Buybacks of shares by H&M during week 8, 2024
H & M Hennes & Mauritz AB: Buybacks of shares by H&M during week 7, 2024
H & M Hennes & Mauritz AB: CORRECTION: Buybacks of shares by H&M during week 6, 2024
H & M Hennes & Mauritz AB: Buybacks of shares by H&M during week 6, 2024
H & M Hennes & Mauritz AB: Buybacks of shares by H&M during week 5, 2024

Share price drop offers an entry point
H & M Hennes & Mauritz AB Full-year report
H & M Hennes & Mauritz AB: Daniel Ervér new President and CEO for the H&M group
H & M Hennes & Mauritz AB: Buybacks of shares by H&M during week 4, 2024