Koskisen
7,72 EUR +0,52%669 investorer følger denne virksomhed
Koskisen is active in the forest industry. The company specializes in the manufacture and distribution of industrial wood products. The company's product portfolio is broad and mainly includes wood products such as sawn wood, plywood, chipboard, and veneer. The business is run via various business segments and the customers can be found in a number of industries around the global market. The largest presence is found in Finland. The company was founded in 1909 and has its headquarters in Järvelä, Finland.
Læs mereP/E (24e)
13,11
EV/EBIT (adj.) (24e)
10,43
P/B (24e)
1,16
Udbytteafkast, % (24e)
4,15 %
Kursmål
7.00 EUR
Anbefaling
Reducer
Opdateret
14.5.2024
NASDAQ Helsinki
KOSKI
Daglig lav / høj pris
7,68 / 7,8
EUR
Markedsværdi
177,75 mio. EUR
Aktieomsætning
17,37 t EUR
Volumen
2,3 t
Business risk
Valuation risk
Current
Previous
Seneste analyser
Extensive report
Inderes' extensive report is an investor's handbook on customer companies covered by our research.
The latest extensive report was released
Read the reportAnalyst

Antti Viljakainen
Head of Research
Seneste videoer
Finanskalender
Delårsrapport
16.08.2024
Delårsrapport
15.11.2024
Større aktionærerKilde: Millistream Market Data AB
| Ejer | Kapital | Stemmer |
|---|---|---|
| Kari Koskinen | 18,3 % | 18,3 % |
| Markku Koskinen | 16,2 % | 16,2 % |
Premium
This content is for our Premium customers only.
Insider transaktioner
| Insider | Date | Total value |
|---|---|---|
| Eva Wathén | 09.01.2024 | 460.000EUR |
| Kari Koskinen | 09.01.2024 | 1.633.443EUR |
Premium
This content is for our Premium customers only.
Resultatopgørelse
| 2020 | 2021 | 2022 | 2023 | 2024e | 2025e | 2026e | 2027e | |
|---|---|---|---|---|---|---|---|---|
| Omsætning | 220,0 | 311,3 | 317,7 | 271,2 | 290,9 | 338,5 | 357,3 | 366,5 |
| vækst-% | -16,7 % | 41,5 % | 2,1 % | -14,6 % | 7,3 % | 16,3 % | 5,6 % | 2,6 % |
| EBITDA | 11,3 | 62,2 | 66,3 | 33,0 | 30,1 | 35,1 | 40,6 | 43,3 |
| EBIT (adj.) | 2,2 | 52,7 | 58,5 | 24,4 | 18,7 | 22,3 | 26,9 | 29,2 |
| EBIT | 2,2 | 52,7 | 58,2 | 24,4 | 18,7 | 22,3 | 26,9 | 29,2 |
| Overskud før skat | -4,4 | 47,9 | 57,8 | 24,0 | 16,9 | 21,0 | 25,5 | 28,0 |
| Netto indkomst | -3,3 | 29,2 | 39,8 | 20,2 | 13,6 | 16,8 | 20,4 | 22,4 |
| EPS (adj.) | -0,14 | 1,27 | 1,74 | 0,88 | 0,59 | 0,73 | 0,89 | 0,97 |
| vækst-% | 37,3 % | -49,6 % | -33,0 % | 23,7 % | 21,7 % | 9,5 % | ||
| Udbytte | 0,00 | 0,00 | 0,43 | 0,30 | 0,32 | 0,32 | 0,32 | 0,35 |
| Udbytte ratio | 25,1 % | 34,2 % | 54,3 % | 43,9 % | 36,1 % | 36,0 % |
Profitability and return on capital
| 2020 | 2021 | 2022 | 2023 | 2024e | 2025e | 2026e | 2027e | |
|---|---|---|---|---|---|---|---|---|
| EBITDA-% | 5,2 % | 20,0 % | 20,9 % | 12,2 % | 10,3 % | 10,4 % | 11,4 % | 11,8 % |
| EBIT-% (adj.) | 1,0 % | 16,9 % | 18,4 % | 9,0 % | 6,4 % | 6,6 % | 7,5 % | 8,0 % |
| EBIT-% | 1,0 % | 16,9 % | 18,3 % | 9,0 % | 6,4 % | 6,6 % | 7,5 % | 8,0 % |
| ROE | -39,6 % | 138,8 % | 46,4 % | 14,3 % | 9,0 % | 10,6 % | 12,0 % | 12,2 % |
| ROI | 2,2 % | 45,2 % | 35,8 % | 12,1 % | 9,0 % | 10,5 % | 12,5 % | 13,4 % |
Værdiansættelse
| 2020 | 2021 | 2022 | 2023 | 2024e | 2025e | 2026e | 2027e | |
|---|---|---|---|---|---|---|---|---|
| Aktiekurs (EUR) | 6,28 | 6,00 | 7,72 | 7,72 | 7,72 | 7,72 | ||
| Aktier | 23,0 | 23,0 | 23,0 | 23,0 | 23,0 | 23,0 | 23,0 | 23,0 |
| Markedsværdi | 144,6 | 138,1 | 177,8 | 177,8 | 177,8 | 177,8 | ||
| Enterprise value | 116,1 | 146,1 | 194,6 | 192,9 | 180,6 | 164,9 | ||
| EV/S | - | - | 0,4 | 0,5 | 0,7 | 0,6 | 0,5 | 0,4 |
| EV/EBITDA | - | - | 1,8 | 4,4 | 6,5 | 5,5 | 4,4 | 3,8 |
| EV/EBIT (adj.) | - | - | 2,0 | 6,0 | 10,4 | 8,7 | 6,7 | 5,6 |
| EV/EBIT | - | - | 2,0 | 6,0 | 10,4 | 8,7 | 6,7 | 5,6 |
| P/E (adj.) | - | - | 3,6 | 6,8 | 13,1 | 10,6 | 8,7 | 7,9 |
| P/E | - | - | 3,6 | 6,8 | 13,1 | 10,6 | 8,7 | 7,9 |
| P/B | - | - | 1,1 | 0,9 | 1,2 | 1,1 | 1,0 | 0,9 |
| P/S | - | - | 0,5 | 0,5 | 0,6 | 0,5 | 0,5 | 0,5 |
| Udbytteprocent | 6,9 % | 5,0 % | 4,2 % | 4,2 % | 4,2 % | 4,5 % | ||
| Equity ratio | 13,4 % | 29,4 % | 52,5 % | 54,7 % | 54,8 % | 57,2 % | 60,7 % | 65,5 % |
| Gearing ratio | 350,4 % | 57,9 % | -21,0 % | 5,4 % | 11,0 % | 9,3 % | 1,6 % | -6,7 % |
Kvartalsdata
| Q2/23 | Q3/23 | Q4/23 | 2023 | Q1/24 | Q2/24e | Q3/24e | Q4/24e | 2024e | |
|---|---|---|---|---|---|---|---|---|---|
| Omsætning | 73,9 | 55,5 | 68,7 | 271,2 | 63,7 | 75,1 | 70,6 | 81,5 | 290,9 |
| EBITDA | 13,8 | 1,3 | 5,3 | 33,0 | 5,5 | 9,7 | 5,8 | 9,0 | 30,1 |
| EBIT | 11,7 | -1,0 | 3,0 | 24,4 | 3,1 | 6,7 | 2,8 | 6,0 | 18,7 |
| Overskud før skat | 12,3 | -1,3 | 2,8 | 24,0 | 2,8 | 6,3 | 2,3 | 5,5 | 16,9 |
| Netto indkomst | 9,8 | -1,0 | 2,6 | 20,2 | 2,3 | 5,1 | 1,8 | 4,4 | 13,6 |
ViserAlle indholdstyper
Still in search of a more stable opportunity to buy
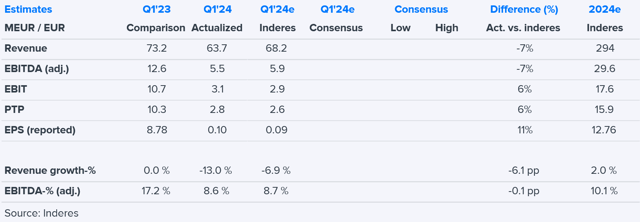
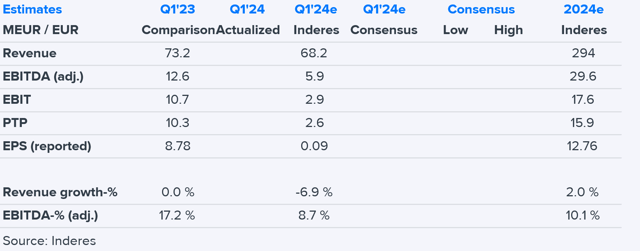
Koskisen Q1 morning result: Result fell slightly as expected, but revenue lagged behind
Join Inderes community
Don't miss out - create an account and get all the possible benefits
Inderes account
Followings and notifications on followed companies
Analyst comments and recommendations
Stock comparison tool & other popular tools

Koskisen, Q1, 2024
Koskisen’s long term share-based incentive program for key personnel
Koskisen’s profitability weakened year-on-year – the demand for and prices of plywood products remained still stable
Koskisen specifies its growth strategy