Kreate Group
7,76 EUR -0,51%3.030 investorer følger denne virksomhed
Kreate Group is active in the infrastructure sector. The company offers a wide range of services in the development of demanding industrial projects. Examples of services include repair and construction of bridges, track construction for trains and rails, as well as mass excavation and crushing of stone for extensions of new motorways. The largest business operations are in the Nordic market.
P/E (24e)
13,93
EV/EBIT (adj.) (24e)
10,51
P/B (24e)
1,59
Udbytteafkast, % (24e)
6,31 %
Kursmål
8.50 EUR
Anbefaling
Akkumulér
Opdateret
28.4.2024
NASDAQ Helsinki
KREATE
Daglig lav / høj pris
7,7 / 7,84
EUR
Markedsværdi
69,72 mio. EUR
Aktieomsætning
21,44 t EUR
Volumen
2,8 t
Business risk
Valuation risk
Current
Previous
Seneste analyser
Extensive report
Inderes' extensive report is an investor's handbook on customer companies covered by our research.
The latest extensive report was released
Read the reportAnalyst

Olli Koponen
Analytiker
Seneste videoer
Finanskalender
Delårsrapport
16.07.2024
Halvårligt udbytte
25.09.2024
Delårsrapport
25.10.2024
Større aktionærerKilde: Millistream Market Data AB
| Ejer | Kapital | Stemmer |
|---|---|---|
| Harjavalta Oy | 19,9 % | 19,9 % |
| Tirinom Oy | 11,1 % | 11,1 % |
Premium
This content is for our Premium customers only.
Insider transaktioner
| Insider | Date | Total value |
|---|---|---|
| Timo Kohtamäki | 05.09.2023 | 24.780EUR |
| Timo Kohtamäki | 04.09.2023 | 54.542EUR |
Premium
This content is for our Premium customers only.
Resultatopgørelse
| 2020 | 2021 | 2022 | 2023 | 2024e | 2025e | 2026e | 2027e | |
|---|---|---|---|---|---|---|---|---|
| Omsætning | 235,3 | 237,6 | 273,9 | 320,0 | 279,5 | 297,4 | 309,6 | 318,8 |
| vækst-% | 6,4 % | 1,0 % | 15,3 % | 16,8 % | -12,7 % | 6,4 % | 4,1 % | 3,0 % |
| EBITDA | 14,0 | 14,2 | 13,6 | 14,0 | 15,1 | 17,2 | 18,7 | 20,2 |
| EBIT (adj.) | 10,4 | 10,3 | 8,6 | 7,6 | 9,0 | 10,8 | 11,8 | 12,9 |
| EBIT | 10,4 | 10,3 | 8,6 | 7,6 | 9,0 | 10,8 | 11,8 | 12,9 |
| Overskud før skat | 9,3 | 8,2 | 6,7 | 4,7 | 6,3 | 8,3 | 9,2 | 10,5 |
| Netto indkomst | 7,8 | 6,9 | 5,7 | 3,9 | 5,0 | 6,5 | 7,2 | 8,2 |
| EPS (adj.) | 0,87 | 0,90 | 0,64 | 0,44 | 0,56 | 0,73 | 0,81 | 0,92 |
| vækst-% | -11,1 % | 3,2 % | -29,5 % | -31,2 % | 27,4 % | 30,4 % | 11,6 % | 13,7 % |
| Udbytte | 0,44 | 0,45 | 0,46 | 0,48 | 0,49 | 0,50 | 0,51 | 0,52 |
| Udbytte ratio | 50,4 % | 56,4 % | 72,4 % | 109,7 % | 88,0 % | 68,9 % | 62,9 % | 56,5 % |
Profitability and return on capital
| 2020 | 2021 | 2022 | 2023 | 2024e | 2025e | 2026e | 2027e | |
|---|---|---|---|---|---|---|---|---|
| EBITDA-% | 6,0 % | 6,0 % | 5,0 % | 4,4 % | 5,4 % | 5,8 % | 6,0 % | 6,3 % |
| EBIT-% (adj.) | 4,4 % | 4,4 % | 3,1 % | 2,4 % | 3,2 % | 3,6 % | 3,8 % | 4,1 % |
| EBIT-% | 4,4 % | 4,4 % | 3,1 % | 2,4 % | 3,2 % | 3,6 % | 3,8 % | 4,1 % |
| ROE | 24,7 % | 20,5 % | 13,6 % | 9,1 % | 11,5 % | 14,5 % | 15,3 % | 16,3 % |
| ROI | 16,1 % | 15,8 % | 11,2 % | 9,0 % | 10,8 % | 12,5 % | 13,2 % | 14,2 % |
Værdiansættelse
| 2020 | 2021 | 2022 | 2023 | 2024e | 2025e | 2026e | 2027e | |
|---|---|---|---|---|---|---|---|---|
| Aktiekurs (EUR) | 11,35 | 8,09 | 7,22 | 7,76 | 7,76 | 7,76 | 7,76 | |
| Aktier | 8,9 | 8,7 | 9,0 | 8,9 | 8,9 | 8,9 | 8,9 | 8,9 |
| Markedsværdi | 98,7 | 72,7 | 64,2 | 69,0 | 69,0 | 69,0 | 69,0 | |
| Enterprise value | 119,6 | 106,1 | 81,0 | 94,6 | 100,0 | 98,6 | 95,9 | |
| EV/S | - | 0,5 | 0,4 | 0,3 | 0,3 | 0,3 | 0,3 | 0,3 |
| EV/EBITDA | - | 8,4 | 7,8 | 5,8 | 6,3 | 5,8 | 5,3 | 4,8 |
| EV/EBIT (adj.) | - | 11,6 | 12,3 | 10,7 | 10,5 | 9,3 | 8,4 | 7,4 |
| EV/EBIT | - | 11,6 | 12,3 | 10,7 | 10,5 | 9,3 | 8,4 | 7,4 |
| P/E (adj.) | - | 12,6 | 12,7 | 16,5 | 13,9 | 10,7 | 9,6 | 8,4 |
| P/E | - | 14,2 | 12,7 | 16,5 | 13,9 | 10,7 | 9,6 | 8,4 |
| P/B | - | 2,4 | 1,7 | 1,5 | 1,6 | 1,5 | 1,4 | 1,3 |
| P/S | - | 0,4 | 0,3 | 0,2 | 0,2 | 0,2 | 0,2 | 0,2 |
| Udbytteprocent | 4,0 % | 5,7 % | 6,7 % | 6,3 % | 6,4 % | 6,6 % | 6,7 % | |
| Equity ratio | 26,3 % | 38,6 % | 31,6 % | 31,7 % | 33,6 % | 33,3 % | 34,4 % | 36,2 % |
| Gearing ratio | 104,7 % | 50,9 % | 78,5 % | 39,3 % | 59,0 % | 68,2 % | 61,2 % | 51,7 % |
Kvartalsdata
| Q2/23 | Q3/23 | Q4/23 | 2023 | Q1/24 | Q2/24e | Q3/24e | Q4/24e | 2024e | |
|---|---|---|---|---|---|---|---|---|---|
| Omsætning | 85,8 | 88,3 | 80,2 | 320,0 | 54,4 | 72,1 | 77,6 | 75,4 | 279,5 |
| EBITDA | 4,1 | 4,0 | 4,8 | 14,0 | 1,6 | 3,6 | 5,0 | 4,9 | 15,1 |
| EBIT | 2,5 | 2,8 | 2,6 | 7,6 | 0,2 | 2,1 | 3,6 | 3,1 | 9,0 |
| Overskud før skat | 1,9 | 1,7 | 1,9 | 4,7 | -0,6 | 1,5 | 2,9 | 2,5 | 6,3 |
| Netto indkomst | 1,5 | 1,4 | 1,6 | 3,9 | -0,6 | 1,2 | 2,3 | 2,0 | 5,0 |
ViserAlle indholdstyper

Kreate, Capital Markets Day, 2024
Kreate's Capital Markets Day 2024: Focus on improving profitability
Join Inderes community
Don't miss out - create an account and get all the possible benefits
Inderes account
Followings and notifications on followed companies
Analyst comments and recommendations
Stock comparison tool & other popular tools
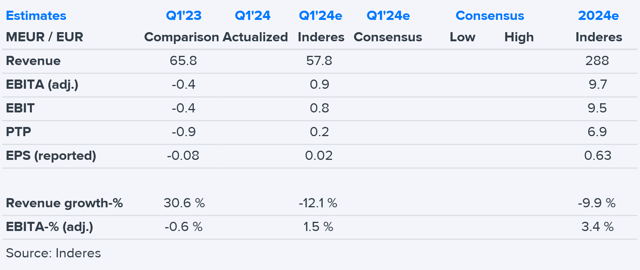
Kreate: Market traction improving

Kreate, Q1, 2024
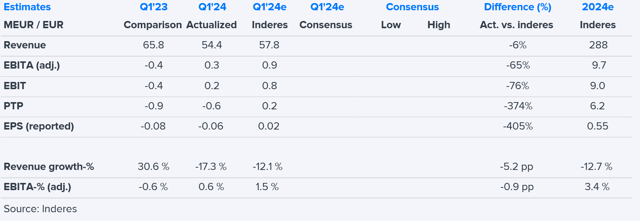
Kreate Q1 morning result: Moderate result, visible upturn in outlook
Kreate Group's financial targets for the strategy period 2024–2027 – Focus on improving profitability
Kreate’s interim report: EBITA increased year-on-year – revenue decreased as expected
Kreate Q1 next Friday: A year of earnings growth
Changes in Kreate Group’s Management Team
Decisions taken by Kreate Group Plc’s Annual General Meeting and Board of Directors
Kreate Group’s Annual Review for 2023 has been published
Kreate Group Plc’s Board of Directors decided on a new share bonus plan
Notice to the Annual General Meeting of Kreate Group Plc
Kreate: Earnings trend about to reverse