Netum Group
2,78 EUR +2,21%1.686 investorer følger denne virksomhed
Netum operates in the IT sector. The company specializes in the development of software solutions. The software is self-developed and is mainly used for the design and implementation of software, management and monitoring of information systems, cyber security solutions, and for IT management. The customers consist of corporate customers operating in a number of sectors. In addition to the main business, various value-added services are offered. The largest operations are in the Nordic region.
P/E (24e)
11,95
EV/EBIT (adj.) (24e)
8,58
EV/S (24e)
0,89
Udbytteafkast, % (24e)
5,04 %
Kursmål
3.20 EUR
Anbefaling
Akkumulér
Opdateret
7.5.2024
First North Finland
NETUM
Daglig lav / høj pris
2,78 / 2,78
EUR
Markedsværdi
35,55 mio. EUR
Aktieomsætning
41,7 EUR
Volumen
15
Business risk
Valuation risk
Current
Previous
Større aktionærerKilde: Millistream Market Data AB
| Ejer | Kapital | Stemmer |
|---|---|---|
| Matti Mujunen | 15,4 % | 15,4 % |
| Cascate Oy (Olavi Köngäs) | 11,8 % | 11,8 % |
Premium
This content is for our Premium customers only.
Insider transaktioner
| Insider | Date | Total value |
|---|---|---|
| Mari Ala-sorvari | 15.11.2023 | 2.700EUR |
| Olavi Köngäs | 09.11.2023 | 5.229EUR |
Premium
This content is for our Premium customers only.
Resultatopgørelse
| 2020 | 2021 | 2022 | 2023 | 2024e | 2025e | 2026e | 2027e | |
|---|---|---|---|---|---|---|---|---|
| Omsætning | 17,5 | 22,4 | 29,1 | 37,1 | 45,2 | 46,1 | 47,6 | 49,8 |
| vækst-% | 31,1 % | 27,7 % | 30,2 % | 27,2 % | 22,0 % | 1,8 % | 3,2 % | 4,7 % |
| EBITDA | 3,3 | 3,4 | 2,8 | 2,6 | 4,9 | 5,0 | 5,2 | 5,6 |
| EBIT (adj.) | 3,1 | 3,1 | 2,5 | 2,8 | 4,7 | 4,8 | 5,0 | 5,4 |
| EBIT | 2,0 | 1,9 | 0,8 | -0,2 | 1,4 | 1,5 | 1,7 | 2,1 |
| Overskud før skat | 1,8 | 0,9 | 0,6 | -0,7 | 0,4 | 1,3 | 1,5 | 1,9 |
| Netto indkomst | 1,3 | 0,5 | 0,2 | -1,1 | -0,3 | 0,3 | 0,5 | 1,5 |
| EPS (adj.) | 0,24 | 0,23 | 0,17 | 0,16 | 0,23 | 0,29 | 0,30 | 0,38 |
| vækst-% | 162,8 % | -4,5 % | -26,8 % | -6,0 % | 48,4 % | 22,8 % | 6,2 % | 24,7 % |
| Udbytte | 0,05 | 0,11 | 0,11 | 0,00 | 0,14 | 0,16 | 0,18 | 0,20 |
| Udbytte ratio | 32,8 % | 239,9 % | 700,7 % | -586,7 % | 657,9 % | 427,9 % | 170,8 % |
Profitability and return on capital
| 2020 | 2021 | 2022 | 2023 | 2024e | 2025e | 2026e | 2027e | |
|---|---|---|---|---|---|---|---|---|
| EBITDA-% | 18,6 % | 15,2 % | 9,7 % | 7,1 % | 10,8 % | 10,8 % | 11,0 % | 11,2 % |
| EBIT-% (adj.) | 17,6 % | 13,9 % | 8,7 % | 7,4 % | 10,3 % | 10,4 % | 10,6 % | 10,8 % |
| EBIT-% | 11,5 % | 8,5 % | 2,6 % | -0,6 % | 3,2 % | 3,2 % | 3,6 % | 4,1 % |
| ROE | 30,8 % | 6,1 % | 1,5 % | -8,7 % | -2,4 % | 2,6 % | 5,2 % | 16,2 % |
| ROI | 22,5 % | 15,5 % | 5,1 % | -1,3 % | 6,8 % | 8,1 % | 10,5 % | 13,9 % |
Værdiansættelse
| 2020 | 2021 | 2022 | 2023 | 2024e | 2025e | 2026e | 2027e | |
|---|---|---|---|---|---|---|---|---|
| Aktiekurs (EUR) | 4,46 | 3,75 | 2,62 | 2,78 | 2,78 | 2,78 | 2,78 | |
| Aktier | 9,0 | 11,5 | 11,7 | 12,6 | 12,6 | 12,6 | 12,6 | 12,6 |
| Markedsværdi | 51,4 | 44,0 | 33,1 | 35,1 | 35,1 | 35,1 | 35,1 | |
| Enterprise value | 52,4 | 42,9 | 42,0 | 40,1 | 38,5 | 36,9 | 34,4 | |
| EV/S | - | 2,3 | 1,5 | 1,1 | 0,9 | 0,8 | 0,8 | 0,7 |
| EV/EBITDA | - | 15,4 | 15,2 | 16,1 | 8,2 | 7,7 | 7,1 | 6,2 |
| EV/EBIT (adj.) | - | 16,8 | 16,9 | 15,3 | 8,6 | 8,0 | 7,3 | 6,4 |
| EV/EBIT | - | 27,4 | 56,3 | - | 28,0 | 26,0 | 21,3 | 16,7 |
| P/E (adj.) | - | 19,6 | 22,5 | 16,7 | 11,9 | 9,7 | 9,2 | 7,3 |
| P/E | - | 97,3 | 238,9 | - | - | 114,3 | 66,1 | 23,7 |
| P/B | - | 4,2 | 3,7 | 2,6 | 2,8 | 3,2 | 3,7 | 4,0 |
| P/S | - | 2,3 | 1,5 | 0,9 | 0,8 | 0,8 | 0,7 | 0,7 |
| Udbytteprocent | 2,5 % | 2,9 % | 5,0 % | 5,8 % | 6,5 % | 7,2 % | ||
| Equity ratio | 42,1 % | 60,6 % | 59,6 % | 38,9 % | 40,0 % | 37,7 % | 34,0 % | 32,6 % |
| Gearing ratio | 53,9 % | 7,4 % | -9,2 % | 69,8 % | 39,7 % | 30,7 % | 18,8 % | -7,7 % |
Kvartalsdata
| Q1/23 | Q2/23 | Q3/23 | Q4/23 | 2023 | Q1/24e | Q2/24e | Q3/24e | Q4/24e | |
|---|---|---|---|---|---|---|---|---|---|
| Omsætning | 17,1 | 20,0 | 37,1 | 22,8 | 22,4 | ||||
| EBITDA | 1,2 | 1,4 | 2,6 | 2,7 | 2,2 | ||||
| EBIT | -0,1 | -0,1 | -0,2 | 1,0 | 0,5 | ||||
| Overskud før skat | -0,1 | -0,6 | -0,7 | 0,5 | -0,0 | ||||
| Netto indkomst | -0,3 | -0,8 | -1,1 | 0,1 | -0,4 |
ViserAlle indholdstyper
Netum Group Plc: Netum Group Plc’s business review 1 January–31 March 2024
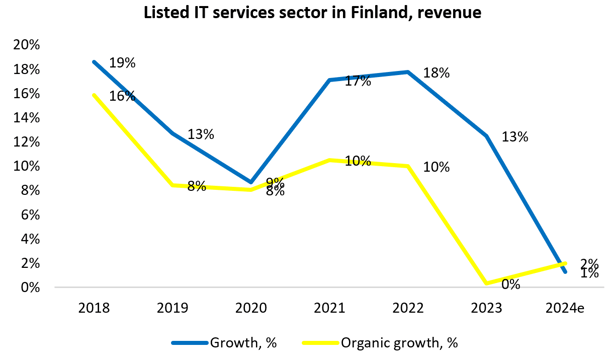
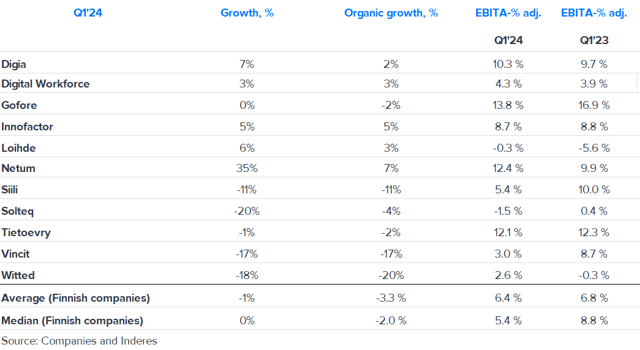
IT service sector: Our expectations for 2024 generally at the lower end of companies' guidance
Join Inderes community
Don't miss out - create an account and get all the possible benefits
Inderes account
Followings and notifications on followed companies
Analyst comments and recommendations
Stock comparison tool & other popular tools
Netum Group Plc: Resolutions of Netum Group Plc’s Annual General Meeting and of the constitutive meeting of the Board of Directors