Purmo Group
9,78 EUR -0,2%1.612 investorer følger denne virksomhed
Purmo Group develops solutions for indoor climate. The company provides heating and cooling solutions for residential buildings and premises, including radiators, towel warmers, underfloor heating, convectors, valves, and controls. The business is divided into a number of business areas and the solutions are used in industry and the real estate industry. Customers are found on a global level with the largest concentration in Europe. The products are aimed at corporate and private customers.
P/E (24e)
11,16
EV/EBIT (adj.) (24e)
9,02
P/B (24e)
0,94
Udbytteafkast, % (24e)
3,57 %
Kursmål
9.91 EUR
Anbefaling
Reducer
Opdateret
28.4.2024
NASDAQ Helsinki
PURMO
Daglig lav / høj pris
9,76 / 9,8
EUR
Markedsværdi
417,39 mio. EUR
Aktieomsætning
498,73 t EUR
Volumen
51 t
Business risk
Valuation risk
Current
Previous
Seneste analyser
Extensive report
Inderes' extensive report is an investor's handbook on customer companies covered by our research.
The latest extensive report was released
Read the reportAnalyst

Rauli Juva
Analytiker
Seneste videoer
Finanskalender
Delårsrapport
17.07.2024
Kvartalsudbytte
18.07.2024
Kvartalsudbytte
17.10.2024
Delårsrapport
22.10.2024
Kvartalsudbytte
16.01.2025
Større aktionærerKilde: Millistream Market Data AB
| Ejer | Kapital | Stemmer |
|---|---|---|
| Rettig Oy Ab | 61,8 % | 61,8 % |
| Virala Oy Ab | 15,2 % | 15,2 % |
Premium
This content is for our Premium customers only.
Insider transaktioner
| Insider | Date | Total value |
|---|---|---|
| Erik Hedin | 13.02.2024 | 13.876EUR |
| Erik Hedin | 07.08.2023 | 13.925EUR |
Premium
This content is for our Premium customers only.
Resultatopgørelse
| 2020 | 2021 | 2022 | 2023 | 2024e | 2025e | 2026e | 2027e | |
|---|---|---|---|---|---|---|---|---|
| Omsætning | 671,2 | 843,6 | 904,1 | 743,2 | 720,0 | 743,0 | 763,8 | 785,5 |
| vækst-% | -3,7 % | 25,7 % | 7,2 % | -17,8 % | -3,1 % | 3,2 % | 2,8 % | 2,8 % |
| EBITDA | 71,9 | 33,6 | 78,4 | 46,6 | 85,8 | 93,6 | 104,9 | 106,2 |
| EBIT (adj.) | 55,2 | 73,7 | 60,7 | 55,4 | 71,8 | 74,6 | 75,2 | 76,0 |
| EBIT | 42,0 | 3,5 | 39,0 | 9,7 | 57,4 | 64,6 | 75,2 | 76,0 |
| Overskud før skat | 31,9 | -5,1 | 21,6 | -9,6 | 36,9 | 48,6 | 58,7 | 60,4 |
| Netto indkomst | 24,9 | -18,8 | 13,2 | -13,2 | 23,0 | 32,6 | 44,4 | 46,5 |
| EPS (adj.) | 0,94 | 1,78 | 0,85 | 0,68 | 0,88 | 1,00 | 1,04 | 1,09 |
| vækst-% | 52,7 % | 90,8 % | -52,5 % | -19,5 % | 28,4 % | 14,0 % | 4,4 % | 4,7 % |
| Udbytte | 0,00 | 0,36 | 0,35 | 0,35 | 0,35 | 0,37 | 0,40 | 0,44 |
| Udbytte ratio | -77,8 % | 112,9 % | -112,9 % | 64,9 % | 48,3 % | 38,4 % | 40,0 % |
Profitability and return on capital
| 2020 | 2021 | 2022 | 2023 | 2024e | 2025e | 2026e | 2027e | |
|---|---|---|---|---|---|---|---|---|
| EBITDA-% | 10,7 % | 4,0 % | 8,7 % | 6,3 % | 11,9 % | 12,6 % | 13,7 % | 13,5 % |
| EBIT-% (adj.) | 8,2 % | 8,7 % | 6,7 % | 7,5 % | 10,0 % | 10,0 % | 9,8 % | 9,7 % |
| EBIT-% | 6,3 % | 0,4 % | 4,3 % | 1,3 % | 8,0 % | 8,7 % | 9,8 % | 9,7 % |
| ROE | 4,8 % | -4,2 % | 3,3 % | -3,1 % | 5,2 % | 7,2 % | 9,9 % | 10,4 % |
| ROI | 6,2 % | 0,5 % | 5,1 % | 1,3 % | 7,7 % | 8,7 % | 10,4 % | 10,8 % |
Værdiansættelse
| 2020 | 2021 | 2022 | 2023 | 2024e | 2025e | 2026e | 2027e | |
|---|---|---|---|---|---|---|---|---|
| Aktiekurs (EUR) | 14,20 | 8,22 | 6,70 | 9,78 | 9,78 | 9,78 | 9,78 | |
| Aktier | 40,7 | 40,7 | 42,7 | 42,7 | 42,7 | 42,7 | 42,6 | 42,6 |
| Markedsværdi | 577,5 | 350,7 | 285,8 | 417,2 | 417,2 | 416,6 | 416,6 | |
| Enterprise value | 816,9 | 627,5 | 560,7 | 647,9 | 635,2 | 610,6 | 585,5 | |
| EV/S | - | 1,0 | 0,7 | 0,8 | 0,9 | 0,9 | 0,8 | 0,7 |
| EV/EBITDA | - | 24,3 | 8,0 | 12,0 | 7,6 | 6,8 | 5,8 | 5,5 |
| EV/EBIT (adj.) | - | 11,1 | 10,3 | 10,1 | 9,0 | 8,5 | 8,1 | 7,7 |
| EV/EBIT | - | 236,1 | 16,1 | 57,8 | 11,3 | 9,8 | 8,1 | 7,7 |
| P/E (adj.) | - | 8,0 | 9,7 | 9,8 | 11,2 | 9,8 | 9,4 | 9,0 |
| P/E | - | - | 25,7 | - | 18,2 | 12,8 | 9,4 | 9,0 |
| P/B | - | 1,5 | 0,9 | 0,7 | 0,9 | 0,9 | 1,0 | 0,9 |
| P/S | - | 0,7 | 0,4 | 0,4 | 0,6 | 0,6 | 0,5 | 0,5 |
| Udbytteprocent | 2,5 % | 4,3 % | 5,2 % | 3,6 % | 3,8 % | 4,1 % | 4,5 % | |
| Equity ratio | 61,9 % | 37,3 % | 41,0 % | 43,7 % | 46,0 % | 46,7 % | 46,2 % | 47,6 % |
| Gearing ratio | 14,5 % | 61,3 % | 68,6 % | 49,5 % | 38,4 % | 34,2 % | 45,0 % | 36,7 % |
Kvartalsdata
| Q2/23 | Q3/23 | Q4/23 | 2023 | Q1/24 | Q2/24e | Q3/24e | Q4/24e | 2024e | |
|---|---|---|---|---|---|---|---|---|---|
| Omsætning | 180,4 | 176,1 | 175,0 | 743,2 | 188,0 | 176,0 | 174,0 | 182,0 | 720,0 |
| EBITDA | 16,9 | 17,3 | -10,7 | 46,6 | 25,3 | 18,5 | 19,5 | 22,5 | 85,8 |
| EBIT | 8,9 | 11,2 | -25,5 | 9,7 | 17,9 | 11,5 | 12,5 | 15,5 | 57,4 |
| Overskud før skat | 4,1 | 7,2 | -30,4 | -9,6 | 12,4 | 6,5 | 7,5 | 10,5 | 36,9 |
| Netto indkomst | 1,9 | 4,5 | -26,1 | -13,2 | 8,2 | 3,7 | 4,4 | 6,7 | 23,0 |
ViserAlle indholdstyper
Inside information: Project Grand Bidco (UK) Limited announces a voluntary recommended public cash tender offer for all the shares in Purmo Group Plc
Purmo Group: Continued margin growth in a weak market
Join Inderes community
Don't miss out - create an account and get all the possible benefits
Inderes account
Followings and notifications on followed companies
Analyst comments and recommendations
Stock comparison tool & other popular tools

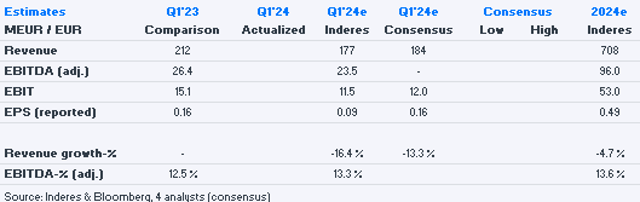
Purmo Group, Q1, 2024
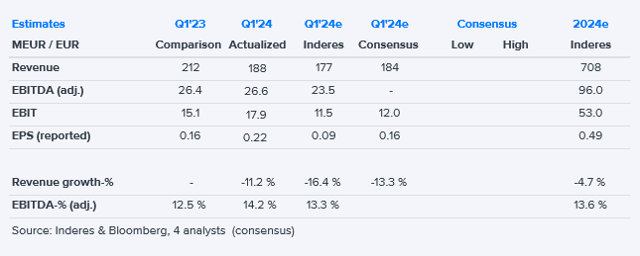
Purmo Q1 morning result: Expectations beat, on par with last year
Purmo Group’s interim report January-March 2024: Clear margin improvement and solid adjusted EBITDA
Purmo Group has agreed to sell its Russian business to a Russian investment company and ended negotiations with IPLS
Purmo's peer sold at a good price
Purmo Q1 next Wednesday: Further decline expected, improvement for the year as a whole
Purmo Group signs an agreement with Kastelli Talot Ltd in Finland
Purmo Group publishes its interim report for January–March 2024 on Wednesday, 24 April 2024
Resolutions of Purmo Group’s Board of Directors’ constitutive meeting
Resolutions of Purmo Group Plc’s Annual General Meeting
Purmo Group's Sustainability Report for 2023 shows continued positive progress
Purmo Group’s Annual Report 2023 has been published
Purmo Group Plc – Managers' transactions – Hedin
Purmo: Performance starting to improve