Anora Group
3,235
EUR
+1,09 %
5.518 følger denne virksomhed
ANORA
NASDAQ Helsinki
Food & Beverage
Consumer Goods & Services
Overview
Finansielt overblik og estimater
Investor consensus
+1,09%
-4,43%
+18,93%
+13,91%
-8,87%
-37,67%
-63,15%
-57,1%
-58,1%
Anora Group is a producer of alcoholic beverages. The product portfolio consists of wine and spirits marketed under various brands. The largest operations are found in the Nordics and the Baltics, and the company's products are exported to retailers in Europe and North America. The company was created through a merger of Altia and Arcus in 2021 and has its headquarters in Helsinki.
Læs mereMarkedsværdi
218,54 mio. EUR
Aktieomsætning
150,13 t EUR
P/E (adj.) (25e)
10,8
EV/EBIT (adj.) (25e)
7,5
P/B (25e)
0,54
EV/S (25e)
0,48
Udbytteafkast, % (25e)
6,8 %

Omsætning og EBIT-margin
Omsætning mio.
EBIT-% (adj.)
EPS og udbytte
EPS (adj.)
Udbytte %
Finanskalender
7.5
2025
Delårsrapport Q1'25
15.8
2025
Delårsrapport Q2'25
31.10
2025
Delårsrapport Q3'25
Risiko
Business risk
Valuation risk
Lav
Høj
Alle
Analyse
Selskabspræsentationer
Selskabsmeddelelser
ViserAlle indholdstyper
Anora Extensive Report: Cash flow supports, creating growth a challenge
Anora's Annual Report for 2024 has been published
Join Inderes community
Don't miss out - create an account and get all the possible benefits
Inderes account
Followings and notifications on followed companies
Analyst comments and recommendations
Stock comparison tool & other popular tools
Anora Group Plc: Notice of the Annual General Meeting 2025
Anora: Kirsi Puntila appointed CEO
Inside information: Kirsi Puntila appointed as new CEO of Anora
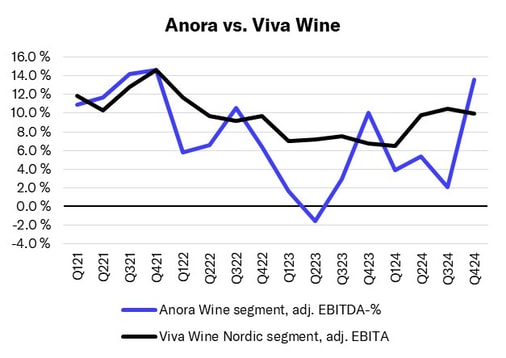
Anora: Good growth from Viva Wine, the main competitor in wines, in Q4 as usual

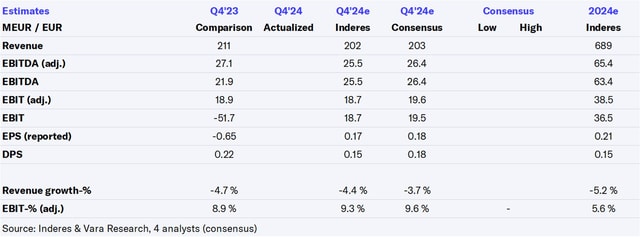
Anora Q4'24: Reasonable cash flow and dividend
Anora Q4'24
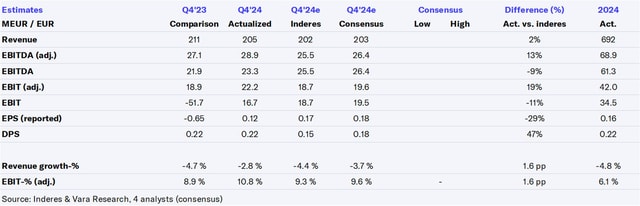
Anora Q4'24 flash comment: Slightly better than expected across the board
Anora Group's Board of Directors decided on a new plan period within the share-based long-term incentive scheme for the management and selected key employees
Anora Group Plc's Financial Statement Release for 1 January - 31 December 2024: Comparable EBITDA improved in Q4 driven by strong performance in the Wine segment
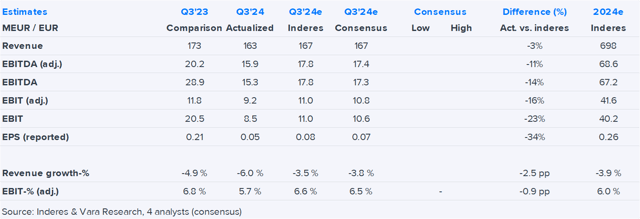
Anora Q4'24 preview: Earnings risk more to the upside
Proposals by Anora's Shareholders' Nomination Board to the Annual General Meeting 2025
Anora: No support from the market
Anora expands in Lithuania
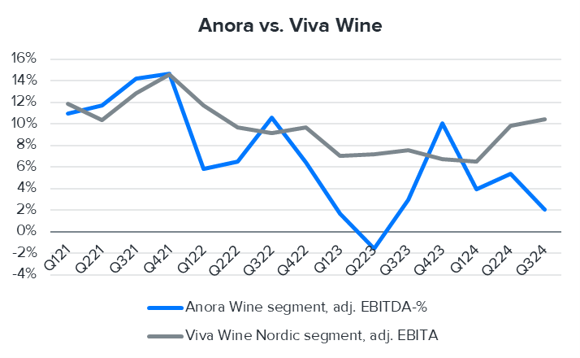
Anora: Viva Wine, the main competitor in wines, continued its good development in Q3
Anora Q3'24: No significant upward turn in sight
Anora, Audiocast, Q3'24