Canatu
9,9
EUR
-1,49 %
1.739 følger denne virksomhed
CANATU
First North Finland
Hardware Manufacturer
Technology
Overview
Finansielt overblik og estimater
Investor consensus
-1,49%
-0,8%
-20,8%
-16,1%
-13,91%
+1,02%
-6,16%
-
-5,86%
Canatu is a technology company active in deep technology that creates carbon nanotubes (Canatu CNT), related products and manufacturing equipment for the semiconductor, automotive and medical diagnostics industries. The company operates through two business models, firstly using their own reactors to develop and manufacture CNT products. Second, the company sells its CNT reactors and licenses its related technology, allowing customers to produce the products themselves under a limited license.
Læs mereMarkedsværdi
343,83 mio. EUR
Aktieomsætning
64,6 t EUR
P/E (adj.) (25e)
-90,66
EV/EBIT (adj.) (25e)
-34,21
EV/S (25e)
11,21
Udbytteafkast, % (25e)
-

Omsætning og EBIT-margin
Omsætning mio.
EBIT-% (adj.)
EPS og udbytte
EPS (adj.)
Udbytte %
Finanskalender
15.5
2025
Generalforsamling '25
29.8
2025
Delårsrapport Q2'25
Risiko
Business risk
Valuation risk
Lav
Høj
Alle
Analyse
Selskabspræsentationer
Selskabsmeddelelser
ViserAlle indholdstyper
Proposals of the Shareholders’ Nomination Board to Canatu’s Annual General Meeting
Correction: Canatu has published the Annual Report for 2024
Join Inderes community
Don't miss out - create an account and get all the possible benefits
Inderes account
Followings and notifications on followed companies
Analyst comments and recommendations
Stock comparison tool & other popular tools
Canatu has published the Annual Report for 2024
Canatu signs multi-million joint development agreement with DENSO
Inside information: Canatu signs joint development agreement with DENSO to improve carbon nanotube performance
Change in the composition of Canatu Plc’s Shareholders’ Nomination Board

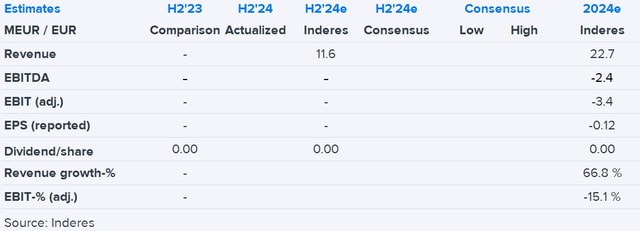
Canatu H2'24: Vague 2025 growth outlook can offer buying opportunities

Canatu, Webcast, Q4'24
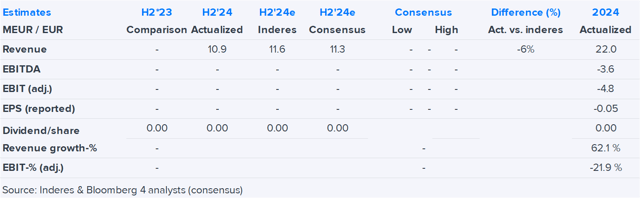
Canatu 2024 flash comment: Growth outlook for this year remains unclear
Canatu to expand with new production facility in Finland, doubling its premises
Canatu’s Financial Statement Bulletin 2024
Canatu appoints Tapani Salminen as the Chief Operations Officer; Mikko Vesterinen’s interim CFO role transitioning to permanent CFO
Canatu’s new Carbon Age program receives 10 MEUR funding from Business Finland
Inside information: Canatu launches Carbon Age program for which it has received EUR 10 million funding granted by Business Finland