Eltel
6,7
SEK
0 %
ELTEL
NASDAQ Stockholm
Industrial Goods & Services
Industrials
26 investorer følger denne virksomhed
0%
+0,3%
-7,46%
-6,69%
-2,62%
0%
-8,22%
-57,81%
-66,75%
-84,62%
www.eltelgroup.com/sv/investerare
Eltel is a provider of technical services for the energy and communications sector. The greatest focus is on the repair and development of transmission systems, infrastructure and networks. The business is run via most business segments on a global level. The largest operations are in the Nordic market. The company was formed in 2004 through a merger of Swedia Networks and Eltel Networks. The head office is located in Stockholm.
P/E (adj.) (24e)
-11,34
EV/EBIT (adj.) (24e)
24,17
P/B (24e)
0,5
Udbytteafkast, % (24e)
-
Kursmål
7.20 SEK
Anbefaling
Reducer
Opdateret
1.11.2024
NASDAQ Stockholm
ELTEL
Daglig lav / høj pris
6,54 / 6,72
SEK
Markedsværdi
1,08 mia. SEK
Aktieomsætning
81,63 t SEK
Volumen
12 t
Business risk
Valuation risk
Current
Previous
Seneste analyser
Extensive report
Inderes' extensive report is an investor's handbook on customer companies covered by our research.
The latest extensive report was released
Read the reportAnalytiker
Aapeli Pursimo
Analytiker
Seneste videoer
Finanskalender
Årsrapport
14.02.2025
Delårsrapport
30.04.2025
Generalforsamling
13.05.2025
Delårsrapport
24.07.2025
Delårsrapport
30.10.2025
Større aktionærerKilde: Millistream Market Data AB
Ejer | Kapital | Stemmer |
---|---|---|
Triton | 16,0 % | 16,4 % |
Wipunen varainhallinta Oy | 14,6 % | 14,9 % |
Fjärde AP-Fonden | 9,4 % | 9,6 % |
Heikintorppa Oy | 8,3 % | 8,5 % |
Mariatorp Oy | 6,2 % | 6,4 % |
Mandatum Life Insurance Company | 5,1 % | 5,3 % |
Fennia Group | 4,4 % | 4,5 % |
Fidelity International (FIL) | 4,4 % | 4,5 % |
Etola Group | 3,7 % | 3,8 % |
Eltel AB | 2,4 % | 0,3 % |
Resultatopgørelse
2020 | 2021 | 2022 | 2023 | 2024e | 2025e | 2026e | 2027e | |
---|---|---|---|---|---|---|---|---|
Omsætning | 938,0 | 812,6 | 823,6 | 850,2 | 828,9 | 843,8 | 877,3 | 902,9 |
vækst-% | -13,8 % | -13,4 % | 1,4 % | 3,2 % | -2,5 % | 1,8 % | 4,0 % | 2,9 % |
EBITDA | 63,0 | 46,5 | 27,8 | 24,8 | 17,0 | 50,3 | 52,9 | 58,0 |
EBIT (adj.) | 11,4 | 14,8 | -1,9 | 1,7 | 10,1 | 20,3 | 25,3 | 29,7 |
EBIT | 24,8 | 14,5 | -2,0 | -5,3 | -16,8 | 20,3 | 25,3 | 29,7 |
Overskud før skat | 15,0 | 8,7 | -11,4 | -18,0 | -29,3 | 9,3 | 15,3 | 19,7 |
Netto indkomst | 4,7 | 4,3 | -15,0 | -8,0 | -31,5 | 5,4 | 11,8 | 15,3 |
EPS (adj.) | -0,06 | 0,03 | -0,10 | -0,02 | -0,05 | 0,01 | 0,06 | 0,10 |
vækst-% | -424,4 % | 380,8 % | 50,6 % | |||||
Udbytte | 0,00 | 0,00 | 0,00 | 0,00 | 0,00 | 0,00 | 0,00 | 0,00 |
Udbytte ratio |
Lønsomhed og afkast på kapital
2020 | 2021 | 2022 | 2023 | 2024e | 2025e | 2026e | 2027e | |
---|---|---|---|---|---|---|---|---|
EBITDA-% | 6,7 % | 5,7 % | 3,4 % | 2,9 % | 2,0 % | 6,0 % | 6,0 % | 6,4 % |
EBIT-% (adj.) | 1,2 % | 1,8 % | -0,2 % | 0,2 % | 1,2 % | 2,4 % | 2,9 % | 3,3 % |
EBIT-% | 2,6 % | 1,8 % | -0,2 % | -0,6 % | -2,0 % | 2,4 % | 2,9 % | 3,3 % |
ROE | 2,2 % | 2,0 % | -7,1 % | -3,8 % | -15,9 % | 3,0 % | 6,7 % | 8,7 % |
ROI | 5,8 % | 3,9 % | -0,5 % | -1,4 % | -4,9 % | 5,9 % | 7,4 % | 8,8 % |
Værdiansættelse
2020 | 2021 | 2022 | 2023 | 2024e | 2025e | 2026e | 2027e | |
---|---|---|---|---|---|---|---|---|
Aktiekurs (EUR) | 2,24 | 1,53 | 0,74 | 0,55 | 0,58 | 0,58 | 0,58 | 0,58 |
Aktier | 156,6 | 156,6 | 156,7 | 156,7 | 156,7 | 156,7 | 156,7 | 156,7 |
Markedsværdi | 351,1 | 239,0 | 115,3 | 86,2 | 90,4 | 90,4 | 90,4 | 90,4 |
Enterprise value | 475,8 | 360,8 | 240,3 | 211,4 | 242,9 | 237,0 | 221,6 | 204,4 |
EV/S | 0,5 | 0,4 | 0,3 | 0,2 | 0,3 | 0,3 | 0,3 | 0,2 |
EV/EBITDA | 7,6 | 7,8 | 8,6 | 8,5 | 14,3 | 4,7 | 4,2 | 3,5 |
EV/EBIT (adj.) | 41,7 | 24,4 | - | 128,1 | 24,2 | 11,7 | 8,8 | 6,9 |
EV/EBIT | 19,2 | 24,9 | - | - | - | 11,7 | 8,8 | 6,9 |
P/E (adj.) | - | 52,1 | - | - | - | 42,6 | 8,9 | 5,9 |
P/E | 74,7 | 55,7 | - | - | - | 42,6 | 8,9 | 5,9 |
P/B | 1,7 | 1,1 | 0,6 | 0,4 | 0,5 | 0,5 | 0,5 | 0,5 |
P/S | 0,4 | 0,3 | 0,1 | 0,1 | 0,1 | 0,1 | 0,1 | 0,1 |
Udbytteprocent | ||||||||
Equity ratio | 34,0 % | 38,3 % | 37,0 % | 39,6 % | 34,8 % | 35,0 % | 32,0 % | 34,3 % |
Gearing ratio | 56,8 % | 53,4 % | 59,2 % | 44,8 % | 67,6 % | 63,7 % | 74,5 % | 59,6 % |
Kvartalsdata
Q4/23 | 2023 | Q1/24 | Q2/24 | Q3/24 | Q4/24e | 2024e | Q1/25e | Q2/25e | |
---|---|---|---|---|---|---|---|---|---|
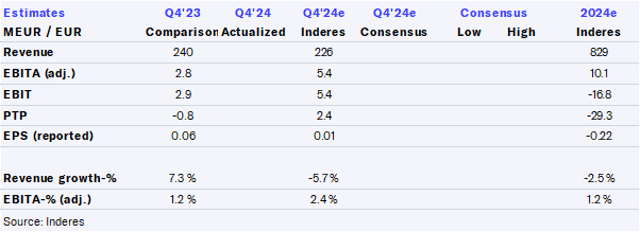
Omsætning | 240,3 | 850,2 | 176,3 | 216,0 | 210,2 | 226,5 | 828,9 | 170,0 | 213,7 |
EBITDA | 10,3 | 24,8 | -19,6 | 8,5 | 15,2 | 12,9 | 17,0 | 4,9 | 11,5 |
EBIT | 2,9 | -5,3 | -27,2 | 0,5 | 4,5 | 5,4 | -16,8 | -2,6 | 4,0 |
Overskud før skat | -0,8 | -18,0 | -30,2 | -2,3 | 0,8 | 2,4 | -29,3 | -5,5 | 1,2 |
Netto indkomst | 10,2 | -8,0 | -30,5 | -2,6 | -0,4 | 1,9 | -31,5 | -5,8 | 0,8 |
ViserAlle indholdstyper
Eltel Q3'24: Gradual improvement continued
Eltel Q3´24: Progress is evident but still lot of room for improvement
Join Inderes community
Don't miss out - create an account and get all the possible benefits
Inderes account
Followings and notifications on followed companies
Analyst comments and recommendations
Stock comparison tool & other popular tools