Enento Group
16,48
EUR
+0,49 %
3.956 følger denne virksomhed
ENENTO
NASDAQ Helsinki
Software
Technology
Overview
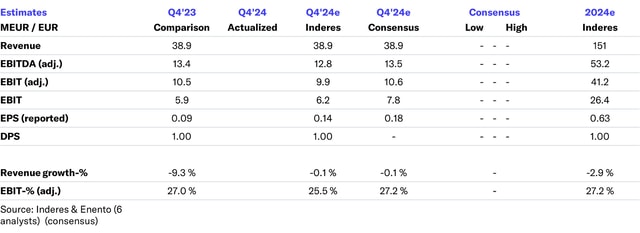
Finansielt overblik og estimater
Investor consensus
+0,49%
+4,3%
-3,06%
-5,72%
-10,34%
-2,37%
-30,9%
-50,51%
+8,14%
Enento operates in the IT sector. Within the Group, there is specialist competence in the development of digital information services that concern risk management, decision-making, sales, and marketing. The vision is to offer programs and digital platforms that can also be used for the analysis of company data, routines, and decision-making processes. The company was previously known as Asiakastieto and is headquartered in Helsinki.
Læs mereMarkedsværdi
390,58 mio. EUR
Aktieomsætning
46,42 t EUR
P/E (adj.) (25e)
17,69
EV/EBIT (adj.) (25e)
13,12
P/B (25e)
1,52
EV/S (25e)
3,5
Udbytteafkast, % (25e)
6,07 %

Omsætning og EBIT-margin
Omsætning mio.
EBIT-% (adj.)
EPS og udbytte
EPS (adj.)
Udbytte %
Finanskalender
15.7
2025
Delårsrapport Q2'25
28.10
2025
Delårsrapport Q3'25
Risiko
Business risk
Valuation risk
Lav
Høj
Alle
Analyse
Selskabspræsentationer
Selskabsmeddelelser
ViserAlle indholdstyper

Enento Q1'25: Return to growth

Enento Q1’25: Rowing Through a Heavy Market
Join Inderes community
Don't miss out - create an account and get all the possible benefits
Inderes account
Followings and notifications on followed companies
Analyst comments and recommendations
Stock comparison tool & other popular tools

Enento, Webcast, Q1'25
Enento Group’s Interim Report 1.1. – 31.3.2025: Sales growth driven by good performance in Business Insight
Enento Q1'25 preview: Uncertainty is also reflected in the price
Enento Group will publish January-March interim report on 25 April 2025
Decisions taken by Enento Group Plc’s Annual General Meeting and Board of Directors
Enento Group’s Annual Report 2024 has been published
Enento Group Plc’s Notice to the Annual General Meeting
Enento Q4'24: Swedish market sets course for this year
Enento, Webcast, Q4'24
Enento Group's Financial Review 2024 and Remuneration Report 2024 have been published
Enento Group’s Financial Statement release 1.1. – 31.12.2024: Business Insight growth and strong free cash flow highlight Enento Group’s resilience amidst the difficult consumer credit market