HKFoods
1,3
EUR
-1,14 %
4.745 følger denne virksomhed
HKFOODS
NASDAQ Helsinki
Food & Beverage
Consumer Goods & Services
Overview
Finansielt overblik og estimater
Investor consensus
-1,14%
+4,84%
+26,83%
+68,39%
+53,66%
+84,14%
-0,46%
-36,59%
-93,56%
HKFoods operates in the food industry. Within the Group, there are a number of subsidiaries with the business of selling, marketing, and producing meat products of pig, beef, and poultry. The Group operates the entire value chain, from slaughter, cutting to processing and resale of the raw materials. HKFoods has the largest operations in the Nordic market. The head office is located in Turku.
Læs mereMarkedsværdi
116,88 mio. EUR
Aktieomsætning
26,98 t EUR
P/E (adj.) (25e)
29,16
EV/EBIT (adj.) (25e)
8,94
P/B (25e)
0,74
EV/S (25e)
0,27
Udbytteafkast, % (25e)
3,64 %
Omsætning og EBIT-margin
Omsætning mia.
EBIT-% (adj.)
EPS og udbytte
EPS (adj.)
Udbytte %
Finanskalender
6.8
2025
Delårsrapport Q2'25
5.11
2025
Delårsrapport Q3'25
Risiko
Business risk
Valuation risk
Lav
Høj
Alle
Analyse
Selskabsmeddelelser
ViserAlle indholdstyper
HKFoods Q1'25 flash comment: Earnings improved in a challenging market
HKFoods Plc's Interim Report Q1/2025: HKFoods' profitability grew clearly in January-March 2025
Join Inderes community
Don't miss out - create an account and get all the possible benefits
Inderes account
Followings and notifications on followed companies
Analyst comments and recommendations
Stock comparison tool & other popular tools
HKFoods Q1'25 preview: Efficiency-driven earnings growth continues
HKFoods: The sale of the Polish bacon unit could be enough to redeem the hybrid bond
HKFoods has launched the investigation to assess the future of its Polish bacon unit
Resolutions passed by the Annual General Meeting of HKFoods Plc and organization of the Board of Directors
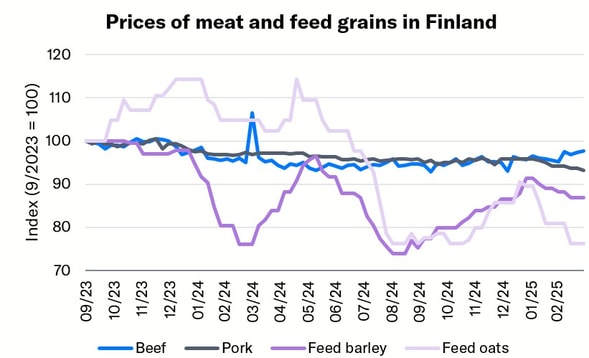
Atria and HKFoods: Meat prices and weak demand challenge earnings growth
Strikes are hitting the meat industry at a challenging time
HKFoods Plc's Annual Review 2024 has been published
HKFoods: Cancellation of treasury shares has no impact on our estimates
HKFoods Plc cancels treasury shares
Notice of the Annual General Meeting of HKFoods Plc
HKFoods: Slaughter capacity is reduced as market volumes decline
HKFoods Q4'24: Balance sheet risks prevail, even if result improves
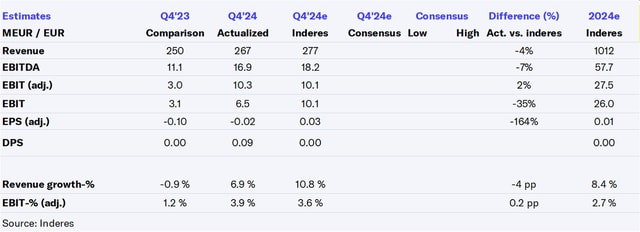
HKFoods Q4'24 flash comment: Strong operating result was expected
Strong development continued in 2024; HKFoods showing clear growth in net sales and comparable EBIT