Hexagon
98,46
SEK
-0,97 %
Mindre end 1K følgere
HEXA B
NASDAQ Stockholm
Hardware Manufacturer
Technology
Overview
Finansielt overblik og estimater
Ownership
Investor consensus
-0,97%
+9,45%
-23,76%
-6,76%
+2,78%
-19,89%
-16,42%
+53,95%
+18.288,61%
Hexagon is a global provider of technology solutions. The company specializes in the development of information technology that is further used in geospatial and industrial applications. The company's solutions mainly integrate sensors, software, industrial knowledge, and customers' workflows into information ecosystems. Customers are found on a global level in various industries. Hexagon was founded in 1975 and is headquartered in Stockholm, Sweden.
Læs mereMarkedsværdi
266,38 mia. SEK
Aktieomsætning
82,31 mio. SEK
P/E (adj.) (25e)
21,27
EV/EBIT (adj.) (25e)
17,29
EV/S (25e)
4,9
Udbytteafkast, % (25e)
1,67 %
Omsætning og EBIT-margin
Omsætning mia.
EBIT-% (adj.)
EPS og udbytte
EPS (adj.)
Udbytte %
Finanskalender
25.7
2025
Delårsrapport Q2'25
24.10
2025
Delårsrapport Q3'25
30.1
2026
Årsrapport '25
Risiko
Business risk
Valuation risk
Lav
Høj
Alle
Analyse
Selskabsmeddelelser
ViserAlle indholdstyper
Annual General Meeting in Hexagon AB

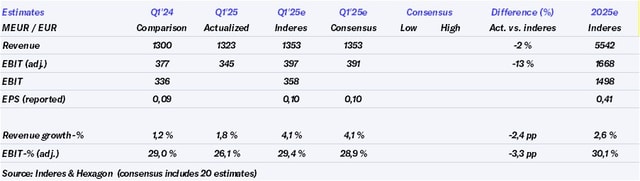
Hexagon Q1'25: Demand outlook better than suspected
Join Inderes community
Don't miss out - create an account and get all the possible benefits
Inderes account
Followings and notifications on followed companies
Analyst comments and recommendations
Stock comparison tool & other popular tools
Hexagon Interim Report 1 January - 31 March 2025
Hexagon to acquire CONET Communications assets to strengthen public safety capabilities

Hexagon: Fear is a friend to the long-term-oriented investor
Hexagon: Tariffs have burdened sensor sales already in March
Hexagon announces an update on performance in the first quarter of 2025
Hexagon Q1'25 preview: Diversification and quality to protect against the worst
Hexagon announces leadership changes in its Manufacturing Intelligence division
Notice to the Annual General Meeting in Hexagon AB (publ)
Hexagon completes the acquisitions of the Geomagic software suite and Septentrio NV
Hexagon launches new Robotics division to drive next-generation autonomy
Hexagon publishes the Annual Report and Sustainability Report 2024
Hexagon appoints Gordon Dale as President of its Autonomous Solutions division
Hexagon AB's Nomination Committee proposes the election of Tomas Eliasson as a new member of the Board of Directors
Hexagon: Spin-off plan progressing with expanded scope
Hexagon prepares for the spin-off of its Asset Lifecycle Intelligence division and related businesses
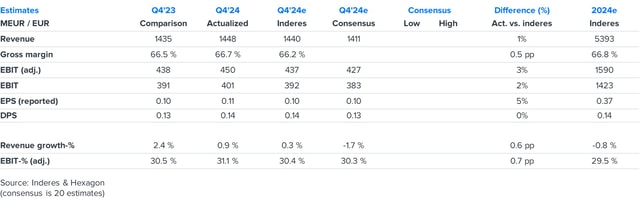
Hexagon Q4'24: Organic growth recovery already priced in