Hexicon
0,15
SEK
+0,13 %
HEXI
First North Stockholm
Renewable
Energy
40 investorer følger denne virksomhed
+0,13%
-18,21%
-37,37%
-72,07%
-74,14%
-76,19%
-71,15%
-93,2%
-
-95,22%
www.hexicongroup.com
Hexicon is a project developer in floating wind that opens up new markets in countries with deep water. The company is also a technology supplier with TwinWind, a patented floating wind design. The technology enables increased use of global wind power and can thus contribute to increased access to renewable energy. Hexicon operates in several markets in Europe, Africa, Asia and North America.
P/E (adj.) (24e)
-0,31
EV/EBIT (adj.) (24e)
-6,19
P/B (24e)
-0,32
Udbytteafkast, % (24e)
-
Kursmål
0.23 SEK
Anbefaling
Reducer
Opdateret
10.10.2024
First North Stockholm
HEXI
Daglig lav / høj pris
0,147 / 0,15
SEK
Markedsværdi
54,57 mio. SEK
Aktieomsætning
1,12 t SEK
Volumen
7,6 t
Business risk
Valuation risk
Current
Previous
Seneste analyser
Extensive report
Inderes' extensive report is an investor's handbook on customer companies covered by our research.
The latest extensive report was released
Read the reportAnalytiker
Lucas Mattsson
Analytiker
Seneste videoer
Finanskalender
Delårsrapport
29.11.2024
Årsrapport
19.02.2025
Delårsrapport
28.05.2025
Delårsrapport
20.08.2025
Større aktionærerKilde: Millistream Market Data AB
Ejer | Kapital | Stemmer |
---|---|---|
Ilija Batljan | 10,1 % | 10,1 % |
Gulfstream Investment Group | 9,6 % | 9,6 % |
SEB Trygg Life | 5,2 % | 5,2 % |
Helikon Investments | 4,6 % | 4,6 % |
Björn Segerblom | 4,1 % | 4,1 % |
Back In Back Capital Limited | 3,2 % | 3,2 % |
Arne Almerfors | 3,1 % | 3,1 % |
Index Equity Sweden AB | 2,5 % | 2,5 % |
Nordnet Pension Insurance | 2,1 % | 2,1 % |
Avanza Pension | 2,1 % | 2,1 % |
Resultatopgørelse
2020 | 2021 | 2022 | 2023 | 2024e | 2025e | 2026e | 2027e | |
---|---|---|---|---|---|---|---|---|
Omsætning | 4,4 | 23,1 | 11,6 | 5,7 | 3,0 | 384,7 | 769,3 | 902,6 |
vækst-% | -55,7 % | 430,3 % | -49,9 % | -50,6 % | -47,9 % | 12.829,6 % | 100,0 % | 17,3 % |
EBITDA | -17,8 | -45,7 | -125,6 | -159,9 | -98,3 | 262,6 | 635,6 | 727,7 |
EBIT (adj.) | -35,9 | -49,8 | -161,1 | -180,3 | -114,5 | 227,8 | 594,0 | 673,7 |
EBIT | -35,9 | -49,8 | -161,1 | -180,3 | -114,5 | 227,8 | 594,0 | 673,7 |
Overskud før skat | -36,9 | -51,0 | -170,8 | -187,9 | -174,8 | 162,3 | 546,7 | 659,1 |
Netto indkomst | -36,9 | -51,2 | -166,9 | -187,3 | -174,6 | 162,3 | 546,7 | 659,1 |
EPS (adj.) | -0,19 | -0,16 | -0,46 | -0,51 | -0,48 | 0,45 | 1,50 | 1,81 |
vækst-% | 236,8 % | 20,6 % | ||||||
Udbytte | 0,00 | 0,00 | 0,00 | 0,00 | 0,00 | 0,00 | 0,00 | 0,00 |
Udbytte ratio |
Lønsomhed og afkast på kapital
2020 | 2021 | 2022 | 2023 | 2024e | 2025e | 2026e | 2027e | |
---|---|---|---|---|---|---|---|---|
EBITDA-% | -409,0 % | -197,9 % | -1.085,1 % | -2.798,5 % | -3.303,4 % | 68,3 % | 82,6 % | 80,6 % |
EBIT-% (adj.) | -824,1 % | -215,3 % | -1.391,8 % | -3.156,0 % | -3.849,7 % | 59,2 % | 77,2 % | 74,6 % |
EBIT-% | -824,1 % | -215,3 % | -1.391,8 % | -3.156,0 % | -3.849,7 % | 59,2 % | 77,2 % | 74,6 % |
ROE | -76,4 % | -24,7 % | -63,5 % | -183,1 % | 204,4 % | -177,2 % | 208,0 % | 76,1 % |
ROI | -74,3 % | -23,9 % | -52,4 % | -53,8 % | -26,6 % | 40,5 % | 80,7 % | 66,6 % |
Værdiansættelse
2020 | 2021 | 2022 | 2023 | 2024e | 2025e | 2026e | 2027e | |
---|---|---|---|---|---|---|---|---|
Aktiekurs (SEK) | 3,00 | 1,46 | 0,69 | 0,15 | 0,15 | 0,15 | 0,15 | |
Aktier | 254,3 | 363,8 | 363,8 | 363,8 | 363,8 | 363,8 | 363,8 | 363,8 |
Markedsværdi | 1.090,7 | 529,7 | 251,8 | 54,6 | 54,6 | 54,6 | 54,6 | |
Enterprise value | 803,0 | 533,6 | 510,3 | 709,2 | 671,5 | 270,1 | -184,3 | |
EV/S | - | 34,8 | 46,1 | 89,3 | 238,4 | 1,7 | 0,4 | - |
EV/EBITDA | - | - | - | - | - | 2,6 | 0,4 | - |
EV/EBIT (adj.) | - | - | - | - | - | 2,9 | 0,5 | - |
EV/EBIT | - | - | - | - | - | 2,9 | 0,5 | - |
P/E (adj.) | - | - | - | - | - | 0,3 | 0,1 | 0,1 |
P/E | - | - | - | - | - | 0,3 | 0,1 | 0,1 |
P/B | - | 3,4 | 2,6 | 134,3 | - | - | 0,1 | 0,0 |
P/S | - | 47,2 | 45,8 | 44,1 | 18,3 | 0,1 | 0,1 | 0,1 |
Udbytteprocent | ||||||||
Equity ratio | 77,9 % | 74,7 % | 44,1 % | 0,2 % | -30,6 % | -1,4 % | 50,3 % | 81,9 % |
Gearing ratio | -116,1 % | -89,1 % | 2,0 % | 21.424,1 % | -377,5 % | -5.548,7 % | 40,2 % | -20,0 % |
Kvartalsdata
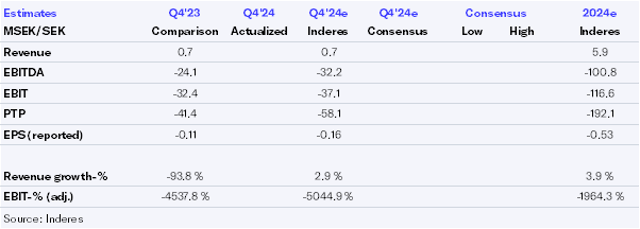
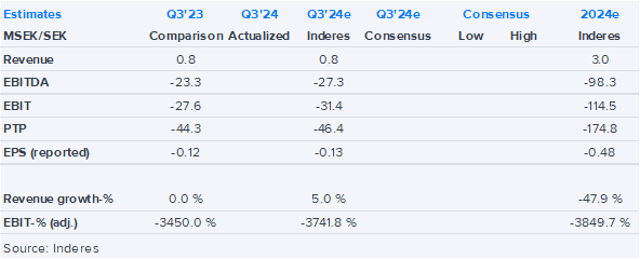
Q3/23 | Q4/23 | 2023 | Q1/24 | Q2/24 | Q3/24e | Q4/24e | 2024e | Q1/25e | |
---|---|---|---|---|---|---|---|---|---|
Omsætning | 0,8 | 0,7 | 5,7 | 0,5 | 0,9 | 0,8 | 0,7 | 3,0 | |
EBITDA | -23,3 | -16,6 | -159,9 | -16,3 | -23,1 | -27,3 | -31,6 | -98,3 | |
EBIT | -27,6 | -22,3 | -180,3 | -19,9 | -26,7 | -31,4 | -36,5 | -114,5 | |
Overskud før skat | -44,3 | -30,7 | -187,9 | -32,2 | -47,7 | -46,4 | -48,5 | -174,8 | |
Netto indkomst | -44,3 | -30,3 | -187,3 | -32,1 | -47,6 | -46,4 | -48,5 | -174,6 |
ViserAlle indholdstyper
Swedish government rejects two of Hexicon’s projects
Two of Hexicon AB’s (publ) offshore wind power projects in Sweden are rejected
Join Inderes community
Don't miss out - create an account and get all the possible benefits
Inderes account
Followings and notifications on followed companies
Analyst comments and recommendations
Stock comparison tool & other popular tools