Koskisen
8,3
EUR
+0,97 %
Mindre end 1K følgere
KOSKI
NASDAQ Helsinki
Paper & Forest Products
Basic Materials
Overview
Finansielt overblik og estimater
Investor consensus
+0,97%
+21,35%
+10,96%
+19,25%
+14,96%
+9,21%
-
-
+27,75%
Koskisen is active in the forest industry. The company specializes in the manufacture and distribution of industrial wood products. The company's product portfolio is broad and mainly includes wood products such as sawn wood, plywood, chipboard, and veneer. The business is run via various business segments and the customers can be found in a number of industries around the global market. The largest presence is found in Finland. The company was founded in 1909 and has its headquarters in Järvelä, Finland.
Læs mereMarkedsværdi
191,69 mio. EUR
Aktieomsætning
5,91 t EUR
P/E (adj.) (25e)
13,06
EV/EBIT (adj.) (25e)
10,71
P/B (25e)
1,14
EV/S (25e)
0,64
Udbytteafkast, % (25e)
2,41 %
Coverage

Head of Research
Omsætning og EBIT-margin
Omsætning mio.
EBIT-% (adj.)
EPS og udbytte
EPS (adj.)
Udbytte %
Finanskalender
15.5
2025
Generalforsamling '25
16.5
2025
Årligt udbytte
18.8
2025
Delårsrapport Q2'25
Risiko
Business risk
Valuation risk
Lav
Høj
Alle
Analyse
Selskabsmeddelelser
ViserAlle indholdstyper
The Zero product family expands with bio-based thin plywood
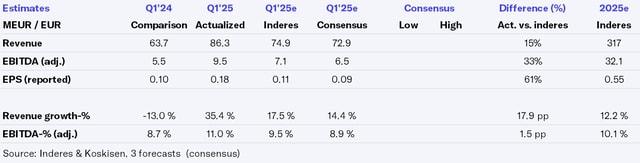
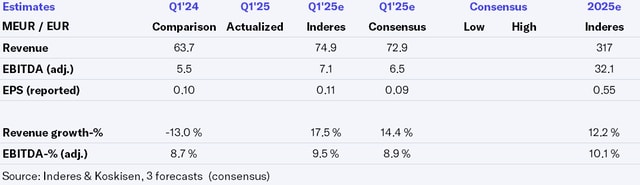
Koskisen Q1’25 flash comment: Excellent business level in Sawn Timber Industry and earnings leverage in high gear
Join Inderes community
Don't miss out - create an account and get all the possible benefits
Inderes account
Followings and notifications on followed companies
Analyst comments and recommendations
Stock comparison tool & other popular tools
Koskisen’s profitability improved – sawmill production at a record-high level
Modular Finance IR Consensus: Koskisen – Consensus estimates Q1 2025