Kreate Group
8,12
EUR
+0,5 %
3.094 følger denne virksomhed
KREATE
NASDAQ Helsinki
Construction & Materials
Industrials
Overview
Finansielt overblik og estimater
Investor consensus
+0,5%
-4,25%
+10,93%
+13,73%
-2,87%
+4,1%
-9,78%
-
-24,04%
Kreate Group is active in the infrastructure sector. The company offers a wide range of services in the development of demanding industrial projects. Examples of services include repair and construction of bridges, track construction for trains and rails, as well as mass excavation and crushing of stone for extensions of new motorways. The largest business operations are in the Nordic market.
Læs mereMarkedsværdi
72,96 mio. EUR
Aktieomsætning
43,39 t EUR
P/E (adj.) (25e)
11,85
EV/EBIT (adj.) (25e)
10,18
P/B (25e)
1,61
EV/S (25e)
0,34
Udbytteafkast, % (25e)
6,28 %
Omsætning og EBIT-margin
Omsætning mio.
EBIT-% (adj.)
EPS og udbytte
EPS (adj.)
Udbytte %
Finanskalender
15.7
2025
Delårsrapport Q2'25
24.9
2025
Halvårligt udbytte
22.10
2025
Delårsrapport Q3'25
Risiko
Business risk
Valuation risk
Lav
Høj
Alle
Analyse
Selskabspræsentationer
Selskabsmeddelelser
ViserAlle indholdstyper

Kreate, Webcast, Q1'25
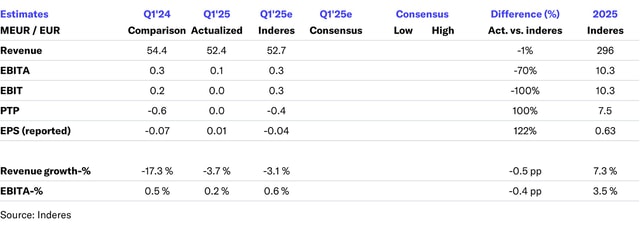
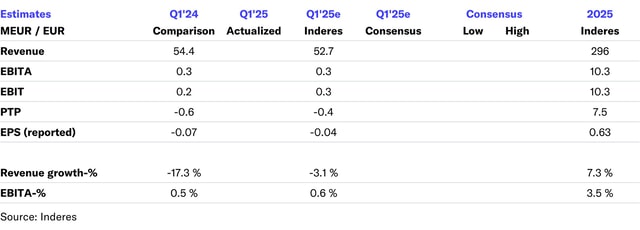
Kreate Q1'25 flash comment: Slightly softer result than expected
Join Inderes community
Don't miss out - create an account and get all the possible benefits
Inderes account
Followings and notifications on followed companies
Analyst comments and recommendations
Stock comparison tool & other popular tools
Kreate’s interim report: The order backlog grew by 28% during the first quarter – EBITA at the level of the comparison period
Kreate Q1'25 preview: Expecting a slight improvement in earnings
Decisions taken by Kreate Group Plc’s Annual General Meeting and Board of Directors
Kreate Group’s Annual Review for 2024 has been published
Notice to the Annual General Meeting of Kreate Group Plc
Kreate has filed a compensation claim against Solwers' subsidiary
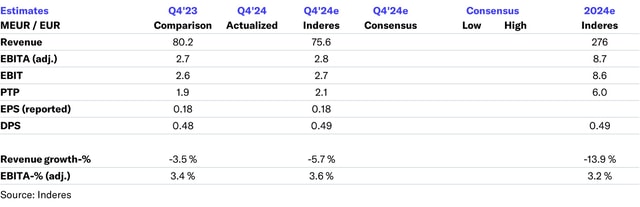
Kreate Q4'24: Back to growth
Kreate, Webcast, Q4'24