NYAB
5,43
SEK
+2,26 %
4.001 følger denne virksomhed
NYAB
First North Stockholm
Multi
Energy
Overview
Finansielt overblik og estimater
Ownership
Investor consensus
+2,26%
-0,91%
+8,82%
+9,26%
-5,73%
+1,47%
-51,62%
+77,38%
-86,12%
NYAB provides services of engineering, construction and maintenance with a focus on sustainable infrastructure and renewable energy. Offering includes, among others, roads, railways, bridges, airports, wind and solar power, as well as power networks. In addition, NYAB provides various types of facilities for industrial clients. NYAB operates in Sweden and Finland within both private and public sector.
Læs mereMarkedsværdi
3,87 mia. SEK
Aktieomsætning
1,01 mio. SEK
P/E (adj.) (25e)
14,29
EV/EBIT (adj.) (25e)
9,8
P/B (25e)
1,69
EV/S (25e)
0,68
Udbytteafkast, % (25e)
2,43 %
Coverage
Omsætning og EBIT-margin
Omsætning mio.
EBIT-% (adj.)
EPS og udbytte
EPS (adj.)
Udbytte %
Finanskalender
7.5
2025
Delårsrapport Q1'25
13.8
2025
Delårsrapport Q2'25
5.11
2025
Delårsrapport Q3'25
Risiko
Business risk
Valuation risk
Lav
Høj
Alle
Analyse
Selskabspræsentationer
Selskabsmeddelelser
Eksterne analyser
ViserAlle indholdstyper
NYAB received an order worth 409 MSEK from the Swedish Transport Administration
NYAB AB: NYAB signs contract to rebuild E4 between Gumboda and Grimsmark - contract value SEK 409 million
Join Inderes community
Don't miss out - create an account and get all the possible benefits
Inderes account
Followings and notifications on followed companies
Analyst comments and recommendations
Stock comparison tool & other popular tools
NYAB AB: Resolutions at the Annual General Meeting 2025

NYAB extensive report: Premium financials to an attractive price tag
NYAB AB: NYAB appoints Arve Jensen as member of the Executive Management Team
NYAB AB: NYAB signs contract for the first section of the North Bothnia Line in Umeå
NYAB AB: Notice to Annual General Meeting 2025
NYAB AB: NYAB publishes Annual and Sustainability Report 2024
NYAB AB: NYAB signs extensive contract for expansion of the port of Umeå
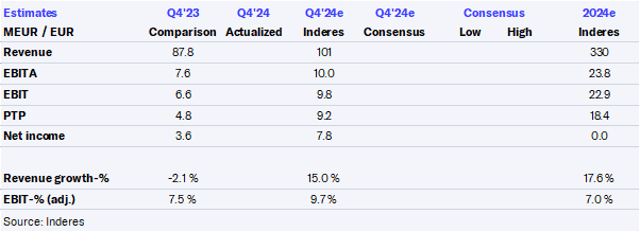
NYAB Q4'24: Strong execution across the board

NYAB Q4'24: Ending the year on a strong note
NYAB, Audiocast, Q4'24
NYAB AB: NYAB publishes pro forma financial information regarding the acquisition of businesses from Dovre Group
NYAB AB's Year-end Report 2024: Strong financial performance creates foundation for future growth