Orthex
5,1
EUR
+0,39 %
4.365 følger denne virksomhed
ORTHEX
NASDAQ Helsinki
Home Products
Consumer Goods & Services
Overview
Finansielt overblik og estimater
Investor consensus
+0,39%
-1,92%
-1,92%
+2%
-15,56%
-16,12%
-33,25%
-
-31,22%
Orthex is a Finnish manufacturer and supplier of household products. The company offers a range of products such as plastic boxes for storage, cutting boards, pots, bowls, and other accessories for the kitchen. Most of the range is accessed digitally via the company's e-commerce platform, and the products are offered via licensed resellers. The largest operations are in the Nordic market.
Læs mereMarkedsværdi
90,57 mio. EUR
Aktieomsætning
15,93 t EUR
P/E (adj.) (25e)
13,2
EV/EBIT (adj.) (25e)
10,38
P/B (25e)
2,34
EV/S (25e)
1,17
Udbytteafkast, % (25e)
4,9 %
Omsætning og EBIT-margin
Omsætning mio.
EBIT-% (adj.)
EPS og udbytte
EPS (adj.)
Udbytte %
Finanskalender
29.4
2025
Generalforsamling '25
30.4
2025
Halvårligt udbytte
15.5
2025
Delårsrapport Q1'25
Risiko
Business risk
Valuation risk
Lav
Høj
Alle
Analyse
Selskabspræsentationer
Selskabsmeddelelser
ViserAlle indholdstyper
Orthex Oyj: Orthex Sustainability Report 2024 published: Promoting circular economy
Orthex Oyj: Orthex Corporation: Annual and Sustainability Report 2024 published
Join Inderes community
Don't miss out - create an account and get all the possible benefits
Inderes account
Followings and notifications on followed companies
Analyst comments and recommendations
Stock comparison tool & other popular tools
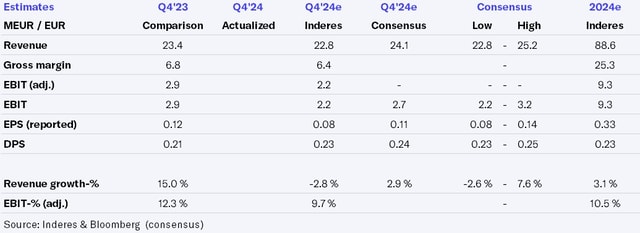
Orthex Q4'24: Better than feared
Orthex, Webcast, Q4'24
Orthex Oyj: Orthex Corporation: Notice to the Annual General Meeting 2025
Orthex Oyj: Orthex Corporation: Financial statements release 1 January-31 December 2024
Orthex Q4'24 preview: Progress checkpoint for European growth strategy
Orthex Oyj: Orthex to publish Financial statements release 2024 on Wednesday, 12 March 2025
Orthex: Growth hampered by sputtering partners
Orthex Oyj: Orthex Corporation: Proposals of the Shareholders' Nomination Board to the Annual General Meeting 2025
Orthex Oyj: Orthex commits to Circular Economy Green Deal
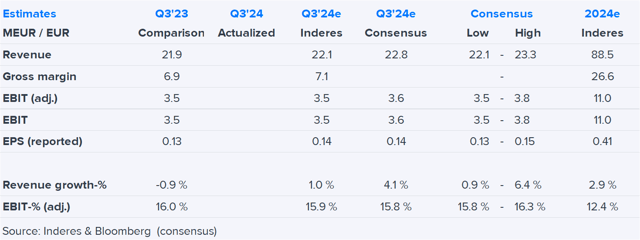
Orthex Q3'24: Price drop opens up the game

Orthex, Q3'24
Orthex Oyj: Orthex Corporation: Interim Report January-September 2024
Orthex Oyj: Orthex Corporation: Financial reporting and AGM in 2025
Orthex Oyj: Orthex Corporation: Change in the Management Team