Ovaro Kiinteistösijoitus
3,85 EUR -1,53%4.303 investorer følger denne virksomhed
Ovaro Kiinteistösijoitus is a company focused on real estate investments and especially real estate development, which mainly buys, develops and sells offices and land areas. Ovaro also owns and rents offices and apartments. The company operates in various parts of Finland, but focuses its operations on Finland's growth centers, i.e. university towns and the capital region.
P/E (24e)
11,72
EV/EBIT (adj.) (24e)
10,79
P/B (24e)
0,67
Udbytteafkast, % (24e)
1,56 %
Kursmål
4.50 EUR
Anbefaling
Akkumulér
Opdateret
13.5.2024
NASDAQ Helsinki
OVARO
Daglig lav / høj pris
3,85 / 3,93
EUR
Markedsværdi
33,11 mio. EUR
Aktieomsætning
10,45 t EUR
Volumen
2,7 t
Business risk
Valuation risk
Current
Previous
Større aktionærerKilde: Millistream Market Data AB
Ejer | Kapital | Stemmer |
---|---|---|
Royal House | 15,3 % | 15,3 % |
Osuusasunnot | 14,1 % | 14,1 % |
Premium
This content is for our Premium customers only.
Insider transaktioner
Insider | Date | Total value |
---|---|---|
Pekka Ollikainen | 15.05.2024 | 31.970EUR |
Aki Pyysing | 10.05.2024 | 15.616EUR |
Premium
This content is for our Premium customers only.
Resultatopgørelse
2020 | 2021 | 2022 | 2023 | 2024e | 2025e | 2026e | 2027e | |
---|---|---|---|---|---|---|---|---|
Omsætning | 9,7 | 8,2 | 5,4 | 5,6 | 6,3 | 7,9 | 8,4 | 44,2 |
vækst-% | -11,7 % | -15,6 % | -33,4 % | 3,0 % | 12,5 % | 24,6 % | 6,6 % | 428,2 % |
EBITDA | -11,7 | -11,6 | 0,6 | 3,1 | 3,9 | 9,2 | 0,6 | 7,4 |
EBIT (adj.) | -11,7 | -11,6 | 0,6 | 3,1 | 3,9 | 9,2 | 0,6 | 7,4 |
EBIT | -11,7 | -11,6 | 0,6 | 3,1 | 3,9 | 9,2 | 0,6 | 7,4 |
Overskud før skat | -14,4 | -14,0 | 0,4 | 2,8 | 3,3 | 8,5 | -0,6 | 6,7 |
Netto indkomst | -11,5 | -13,1 | 0,4 | 2,6 | 2,7 | 8,4 | -0,6 | 5,8 |
EPS (adj.) | -1,25 | -1,46 | 0,05 | 0,30 | 0,33 | 1,01 | -0,08 | 0,70 |
vækst-% | 488,2 % | 8,5 % | 207,4 % | -107,8 % | ||||
Udbytte | 0,00 | 0,00 | 0,03 | 0,13 | 0,06 | 0,08 | 0,10 | 0,15 |
Udbytte ratio | 58,3 % | 42,3 % | 18,1 % | 7,9 % | -127,6 % | 21,5 % |
Lønsomhed og afkast på kapital
2020 | 2021 | 2022 | 2023 | 2024e | 2025e | 2026e | 2027e | |
---|---|---|---|---|---|---|---|---|
EBITDA-% | -121,3 % | -142,4 % | 11,8 % | 56,2 % | 62,6 % | 117,5 % | 7,2 % | 16,7 % |
EBIT-% (adj.) | -121,3 % | -142,4 % | 11,8 % | 56,2 % | 62,6 % | 117,5 % | 7,2 % | 16,7 % |
EBIT-% | -121,3 % | -142,4 % | 11,8 % | 56,2 % | 62,6 % | 117,5 % | 7,2 % | 16,7 % |
ROE | -17,7 % | -25,2 % | 1,0 % | 5,7 % | 5,9 % | 16,3 % | -1,2 % | 10,3 % |
ROI | -8,7 % | -13,4 % | 1,1 % | 5,1 % | 6,3 % | 13,3 % | 0,7 % | 9,7 % |
Værdiansættelse
2020 | 2021 | 2022 | 2023 | 2024e | 2025e | 2026e | 2027e | |
---|---|---|---|---|---|---|---|---|
Aktiekurs (EUR) | 4,16 | 3,06 | 2,82 | 3,51 | 3,85 | 3,85 | 3,85 | 3,85 |
Aktier | 9,2 | 9,0 | 8,7 | 8,4 | 8,3 | 8,3 | 8,3 | 8,3 |
Markedsværdi | 38,3 | 27,5 | 24,6 | 29,5 | 31,9 | 31,9 | 31,9 | 31,9 |
Enterprise value | 89,4 | 30,5 | 35,4 | 37,1 | 42,5 | 47,6 | 64,8 | 19,9 |
EV/S | 9,2 | 3,7 | 6,5 | 6,6 | 6,7 | 6,1 | 7,7 | 0,5 |
EV/EBITDA | - | - | 55,0 | 11,8 | 10,8 | 5,2 | 107,8 | 2,7 |
EV/EBIT (adj.) | - | - | 55,0 | 11,8 | 10,8 | 5,2 | 107,8 | 2,7 |
EV/EBIT | - | - | 55,0 | 11,8 | 10,8 | 5,2 | 107,8 | 2,7 |
P/E (adj.) | - | - | 54,8 | 11,6 | 11,7 | 3,8 | - | 5,5 |
P/E | - | - | 54,8 | 11,6 | 11,7 | 3,8 | - | 5,5 |
P/B | 0,6 | 0,6 | 0,5 | 0,6 | 0,7 | 0,6 | 0,6 | 0,5 |
P/S | 4,0 | 3,4 | 4,5 | 5,3 | 5,1 | 4,1 | 3,8 | 0,7 |
Udbytteprocent | 1,1 % | 3,7 % | 1,6 % | 2,1 % | 2,6 % | 3,9 % | ||
Equity ratio | 50,7 % | 76,1 % | 70,8 % | 72,6 % | 74,3 % | 71,2 % | 57,5 % | 98,3 % |
Gearing ratio | 86,6 % | 6,5 % | 24,1 % | 16,4 % | 22,6 % | 28,5 % | 61,2 % | -20,3 % |
Kvartalsdata
Q1/23 | Q2/23 | Q3/23 | Q4/23 | 2023 | Q1/24e | Q2/24e | Q3/24e | Q4/24e | |
---|---|---|---|---|---|---|---|---|---|
Omsætning | 1,4 | 1,4 | 1,4 | 1,4 | 5,6 | 1,2 | 1,6 | 1,7 | 1,8 |
EBITDA | -0,1 | 3,9 | -0,5 | -0,2 | 3,1 | 0,5 | 0,9 | 1,5 | 1,1 |
EBIT | -0,1 | 3,9 | -0,5 | -0,2 | 3,1 | 0,5 | 0,9 | 1,5 | 1,1 |
Overskud før skat | -0,2 | 3,9 | -0,5 | -0,3 | 2,8 | 0,3 | 0,7 | 1,3 | 0,9 |
Netto indkomst | -0,2 | 3,6 | -0,3 | -0,5 | 2,6 | 0,1 | 0,7 | 1,1 | 0,9 |
ViserAlle indholdstyper
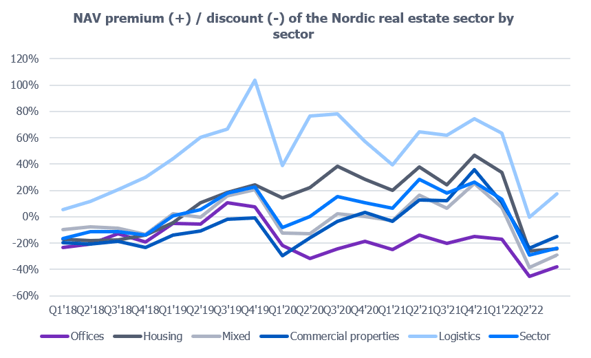
More challenging operating environment reflected in the valuation of the Nordic real estate sector
Join Inderes community
Don't miss out - create an account and get all the possible benefits
Inderes account
Followings and notifications on followed companies
Analyst comments and recommendations
Stock comparison tool & other popular tools