Purmo Group
1.526 følger denne virksomhed
Alle
Analyse
Selskabspræsentationer
Selskabsmeddelelser
ViserAlle indholdstyper
Trading in Purmo stock suspended and our coverage ends
The arbitral tribunal has confirmed Project Grand Bidco (UK) Limited's redemption right over the minority shares in Purmo Group Plc, and trading in the Purmo Group shares has been suspended
Join Inderes community
Don't miss out - create an account and get all the possible benefits
Inderes account
Followings and notifications on followed companies
Analyst comments and recommendations
Stock comparison tool & other popular tools
Change in Purmo Group Plc’s financial reporting in 2025
Jörn Neubert appointed Chief Operating Officer of Purmo Group Plc
Purmo Group reached the Excellence class in the ESG Transparency Award evaluation
Purmo Group Plc applies for the delisting of its shares from the official list of Nasdaq Helsinki
Arbitral tribunal appointed for the arbitration proceedings concerning the redemption of minority shares in Purmo Group Plc
Purmo Group Plc – Managers' transactions – Rettig Oy Ab
Purmo Q3'24: Already on the way out of the stock market

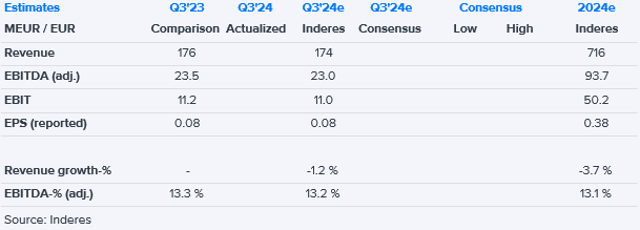
Purmo Q3'24 flash comment: Profitability missed comparison period and our estimates
Purmo Group’s interim report January-September 2024: Pick-up in demand in many sales regions during the quarter, adjusted EBITDA margin remained solid during the review period