Spinnova
0,387
EUR
-0,77 %
5.453 følger denne virksomhed
SPINN
First North Finland
Personal Goods
Consumer Goods & Services
Overview
Finansielt overblik og estimater
Investor consensus
-0,77%
-24,12%
-61,22%
-60,35%
-73,13%
-75,26%
-95,07%
-
-95,93%
Spinnova operates in the textile industry. The company has developed a production technology for textile fibers, known as SPINNOVA® fiber, which is manufactured using a mechanical production process. In addition to the main operations, research and development are conducted in the area and the company offers service and associated ancillary services. Spinnova operates worldwide and is headquartered in Jyväskylä.
Læs mereMarkedsværdi
20,24 mio. EUR
Aktieomsætning
25,65 t EUR
P/E (adj.) (25e)
-0,58
EV/EBIT (adj.) (25e)
0,13
P/B (25e)
0,55
EV/S (25e)
-7,84
Udbytteafkast, % (25e)
-
Coverage

Head of Research
Omsætning og EBIT-margin
Omsætning mio.
EBIT-% (adj.)
EPS og udbytte
EPS (adj.)
Udbytte %
Finanskalender
28.8
2025
Delårsrapport Q2'25
12.2
2026
Årsrapport '25
15.4
2026
Generalforsamling '26
Risiko
Business risk
Valuation risk
Lav
Høj
Alle
Analyse
Selskabspræsentationer
Selskabsmeddelelser
ViserAlle indholdstyper
Inside Information: Spinnova initiates change negotiations to adjust its organisational structure to the company's current development stage and the changed operating environment
Changes in Spinnova Plc's Management Team
Join Inderes community
Don't miss out - create an account and get all the possible benefits
Inderes account
Followings and notifications on followed companies
Analyst comments and recommendations
Stock comparison tool & other popular tools
Resolutions of Spinnova Plc's Annual General Meeting 2025 and the Board of Directors' constitutive meeting
Spinnova's and Suzano's joint venture, Woodspin, assesses conditions for continuing its operations
Inside Information: Spinnova's joint venture Woodspin to initiate change negotiations
Spinnova’s co-founder and Chair of the Board also takes over the position of CEO
Inside Information: Spinnova's founder and Chair of the Board Janne Poranen to start as CEO. He will also continue as Chair of the Board
Spinnova's CEO will change
Inside Information: Spinnova Plc's CEO Tuomas Oijala to leave the Company
Notice to the General Meeting 2025 of Spinnova Plc
Proposals of the Shareholders' Nomination Board to Spinnova Plc's Annual General Meeting 2025
Spinnova: TKO'd by Suzano
Spinnova: Suzano withdraws from collaboration, forcing major strategic review
Inside Information: Suzano will not invest into next steps of collaboration with Spinnova. The companies will begin a strategic review of Woodspin and will renegotiate the exclusivity rights.
Spinnova Q4'24: Burden of proof is still heavy
Spinnova's Governance, Remuneration and Financial Statements 2024 has been published
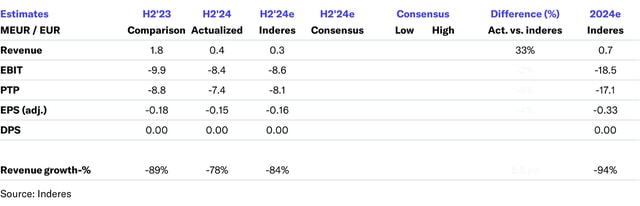
Spinnova H2'24 flash comment: Suzano project timeline still unclear