Starbreeze
0,214
SEK
-2,51 %
Mindre end 1K følgere
STAR B
NASDAQ Stockholm
Software
Technology
Overview
Finansielt overblik og estimater
Ownership
Investor consensus
-2,51%
+15,78%
+8,82%
+1,86%
+7,77%
-20,81%
-71,95%
-76,36%
-98,02%
Starbreeze operates in the gaming industry and focuses on the development, publishing and distribution of computer games and interactive entertainment. The company's portfolio includes both its own games and collaborations with other game developers. The business is aimed at gamers and distributors globally, with the largest operations in Europe. Starbreeze was founded in 1998 and is headquartered in Stockholm, Sweden.
Læs mereMarkedsværdi
346,82 mio. SEK
Aktieomsætning
424,21 t SEK
P/E (adj.) (25e)
15,93
EV/EBIT (adj.) (25e)
8,1
P/B (25e)
0,48
EV/S (25e)
0,62
Udbytteafkast, % (25e)
-
Coverage


Omsætning og EBIT-margin
Omsætning mio.
EBIT-% (adj.)
EPS og udbytte
EPS (adj.)
Udbytte %
Finanskalender
15.5
2025
Generalforsamling '25
19.8
2025
Delårsrapport Q2'25
11.11
2025
Delårsrapport Q3'25
Risiko
Business risk
Valuation risk
Lav
Høj
Alle
Analyse
Selskabspræsentationer
Selskabsmeddelelser
ViserAlle indholdstyper

Starbreeze Q1: Interview with the new CEO
Redeye: Starbreeze - Benefit from independence
Join Inderes community
Don't miss out - create an account and get all the possible benefits
Inderes account
Followings and notifications on followed companies
Analyst comments and recommendations
Stock comparison tool & other popular tools

Starbreeze Q1'25: More updates just around the corner
Starbreeze, Webcast, Q1'25
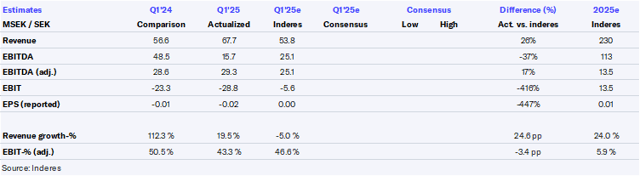
Starbreeze Q1’25 flash comment: PAYDAY revenue was strong
Starbreeze AB (publ) Interim Report January-March 2025
