Björn Borg
57,8
SEK
+0,35 %
Mindre end 1K følgere
BORG
NASDAQ Stockholm
Personal Goods
Consumer Goods & Services
Overview
Finansielt overblik og estimater
Ownership
Investor consensus
+0,35%
+9,06%
+5,07%
+11,99%
+1,96%
+26,45%
+46,22%
+514,02%
+3.236,76%
Björn Borg operates in the fashion industry and focuses on the design, manufacture and distribution of sportswear and underwear. The company's products are aimed at private individuals looking for comfortable and stylish clothing. The business is global with a main presence in the Nordic region and Europe. Björn Borg was founded in 1984 and is headquartered in Solna.
Læs mereMarkedsværdi
1,45 mia. SEK
Aktieomsætning
293,15 t SEK
P/E (adj.) (25e)
18,1
EV/EBIT (adj.) (25e)
14,07
P/B (25e)
4
EV/S (25e)
1,47
Udbytteafkast, % (25e)
5,54 %

Omsætning og EBIT-margin
Omsætning mia.
EBIT-% (adj.)
EPS og udbytte
EPS (adj.)
Udbytte %
Finanskalender
15.5
2025
Generalforsamling '25
15.5
2025
Delårsrapport Q1'25
16.5
2025
Halvårligt udbytte
Risiko
Business risk
Valuation risk
Lav
Høj
Alle
Analyse
Selskabspræsentationer
Selskabsmeddelelser
Eksterne analyser
ViserAlle indholdstyper
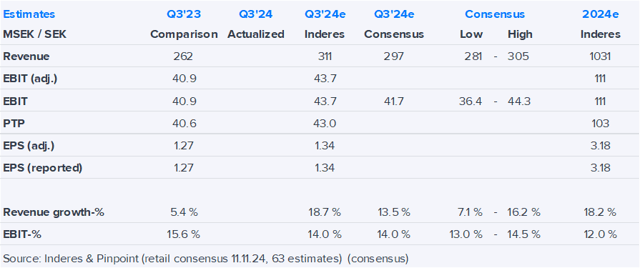
Carnegie Access: Björn Borg: Anticipating maintained fast growth – Q1 preview
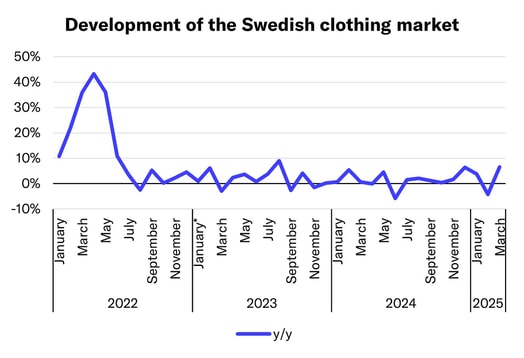
Swedish clothing market grew well in March
Join Inderes community
Don't miss out - create an account and get all the possible benefits
Inderes account
Followings and notifications on followed companies
Analyst comments and recommendations
Stock comparison tool & other popular tools
Björn Borg: Risk/reward looks attractive despite uncertainties
Notice of the Annual General Meeting of Björn Borg AB (publ) (”Björn Borg”), May 15, 2025
Björn Borg AB nomination committee proposal for the Annual General Meeting.
Björn Borg Q4'24: Growth accelerates, but not without trade-offs
Carnegie Access: Björn Borg: Fast growth highlights shoe wear segment potential – Q4 review
Carnegie Access: Björn Borg: Interview– Q4(24) presentation
Carnegie Access: Björn Borg: Strong shoe-driven growth, margins on the soft side
Björn Borg AB, Q4'24
BJÖRN BORG AB YEAREND REPORT JANUARY – DECEMBER 2024
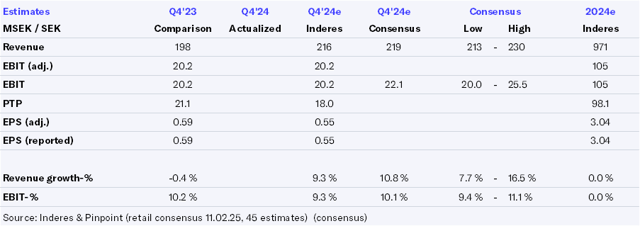
Björn Borg Q4’24 preview: Good growth but shrinking margins
Björn Borg – live presentation February 21st
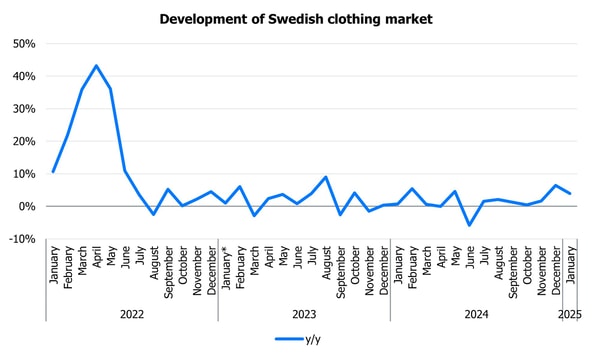
Lindex Group: Swedish clothing market continued to grow in January
Carnegie Access: Björn Borg: Set to grow at double-digits in 2024
Björn Borg Q3'24: Maintaining a good pace despite challenging conditions
BJÖRN BORG AB INTERIM REPORT JANUARY – SEPTEMBER 2024
Björn Borg – live presentation November 15th