Kempower
10,84
EUR
+4,63 %
7.638 følger denne virksomhed
KEMPOWR
NASDAQ Helsinki
Electrical Equipment
Industrials
Overview
Finansielt overblik og estimater
Investor consensus
+4,63%
-14,65%
+0,65%
+11,98%
+3,44%
-40,44%
-8,63%
-
+36,35%
Kempower is active in the industrial sector. The company is a developer of charging solutions and services with a focus on the automotive sector. The range mainly includes charging posts, stations, sockets, and associated electronic equipment. In addition to the main business, various aftermarket services and technical support are offered. The largest operations are in the Nordic countries and Europe.
Læs mereMarkedsværdi
602,09 mio. EUR
Aktieomsætning
1,6 mio. EUR
P/E (adj.) (25e)
-570,55
EV/EBIT (adj.) (25e)
-703,22
P/B (25e)
5,4
EV/S (25e)
2,17
Udbytteafkast, % (25e)
-
Omsætning og EBIT-margin
Omsætning mio.
EBIT-% (adj.)
EPS og udbytte
EPS (adj.)
Udbytte %
Finanskalender
7.5
2025
Generalforsamling '25
24.7
2025
Delårsrapport Q2'25
29.10
2025
Delårsrapport Q3'25
Risiko
Business risk
Valuation risk
Lav
Høj
Alle
Analyse
Selskabspræsentationer
Selskabsmeddelelser
ViserAlle indholdstyper
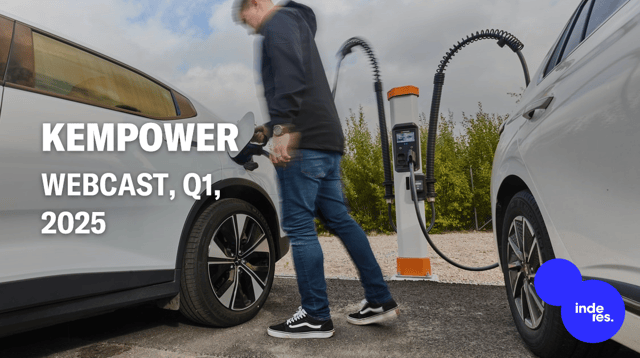
Kempower, Webcast, Q1'25
Kempower has signed a new EUR 40 million green revolving credit facility
Join Inderes community
Don't miss out - create an account and get all the possible benefits
Inderes account
Followings and notifications on followed companies
Analyst comments and recommendations
Stock comparison tool & other popular tools
Kempower Corporation Interim Report, 1 January–31 March 2025: Year started with a strong sales execution
Modular Finance IR Consensus: Kempower – Consensus estimates Q1 2025
Invitation to Kempower’s webcast on Q1/2025 Interim Report
Notice of the Annual General Meeting of Kempower Corporation
Kempower introduces enhanced charging solution with more power, more plugs, and more data - a 1,200 kW Kempower Power Unit with up to 12 charging points
Kempower DC fast-charging solutions installed at Revel charging hubs from coast to coast in the U.S.
Publication of Kempower’s Annual Report 2024
Kempower delivers its DC fast-charging solu-tions to one of the largest EV charging hubs in Malaysia, operated by DC Handal
Comett Plus partners with E.ON and Kempower to electrify bus fleet in the Czech Republic
Change in Kempower Corporation’s holding of treasury shares
Kempower and GodEnergi supports electrification of Danske Fragtmænd’s truck fleet with first of 27 fast-charging stations
Faast Point launches a new public EV charging brand in the Virta charging network with Kempower Station Chargers – Enabling maximum charging speed for most of the EVs on the market
Kempower and TSG drive public transport operator SETA’s e-bus transition in Italy’s Emilia-Romagna region with the opening of two ultra-fast charging depots
Kempower is the official charging partner at Auto 2025 & Mobility – the largest car event in the Nordics
Kempower is named Europe’s eighth fastest growing company (2020-2023 CAGR) by the Financial Times
Kempower is named Europe’s eighth fastest growing company (2020-2023 CAGR) by the Financial Times