Nibe Industrier
40,41
SEK
+0,72 %
Mindre end 1K følgere
NIBE B
NASDAQ Stockholm
Industrial Goods & Services
Industrials
Overview
Finansielt overblik og estimater
Ownership
Investor consensus
+0,72%
+2,82%
-9,25%
-6,54%
-23,93%
-21,59%
-58,4%
-10,4%
+15.072,48%
Nibe Industrier operates in the manufacturing industry and focuses on the development, manufacture and distribution of heat pumps and energy solutions. The company's products are aimed at private individuals and companies looking for energy-efficient solutions. The business is global with a main presence in Europe. Nibe Industrier was founded in 1989 and has its headquarters in Markaryd, Sweden.
Læs mereMarkedsværdi
81,47 mia. SEK
Aktieomsætning
25,32 mio. SEK
P/E (adj.) (25e)
26,22
EV/EBIT (adj.) (25e)
20,57
P/B (25e)
2,35
EV/S (25e)
2,27
Udbytteafkast, % (25e)
1,24 %
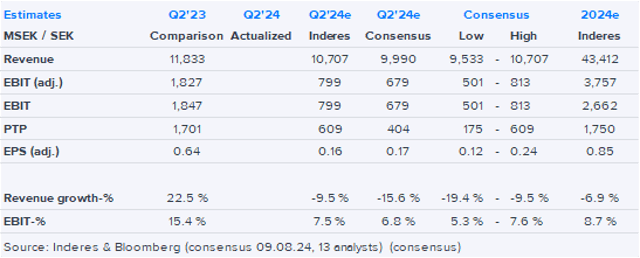
Omsætning og EBIT-margin
Omsætning mia.
EBIT-% (adj.)
EPS og udbytte
EPS (adj.)
Udbytte %
Finanskalender
15.5
2025
Generalforsamling '25
15.5
2025
Delårsrapport Q1'25
16.5
2025
Årligt udbytte
Risiko
Business risk
Valuation risk
Lav
Høj
Alle
Analyse
Selskabspræsentationer
Selskabsmeddelelser
ViserAlle indholdstyper
NIBE Industrier AB (publ) publish the Annual- and Sustainability report 2024
NIBE Industrier AB (publ) - NOTICE OF THE ANNUAL GENERAL MEETING
Join Inderes community
Don't miss out - create an account and get all the possible benefits
Inderes account
Followings and notifications on followed companies
Analyst comments and recommendations
Stock comparison tool & other popular tools
NIBE Industrier AB (publ) appoints Terese Leire as General Counsel
NIBE Q4'24: We remain on the sidelines, waiting for better risk/reward
NIBE, Audiocast with teleconference, Q4'24
NIBE Industrier’s (publ) CEO and MD, Gerteric Lindquist, comments on the Year-end Report, 2024
NIBE Industrier (publ), Year-end Report, 2024

NIBE Industrier Q4'24 preview: Weak risk/reward keeps us on the sidelines
Invitation to teleconference and webcast with presentation of NIBE Industrier AB’s Year-end Report 2024
NIBE Q3'24: Signs of recovery but risk/reward is thin
NIBE Industrier’s (publ) CEO and MD, Gerteric Lindquist, comments on the third quarter, 2024
NIBE Industrier AB (publ), Interim Report 3, 2024
NIBE Q3’24 preview: Another weak quarter, but signs of recovery expected
Invitation to teleconference and webcast with presentation of NIBE Industrier AB’s financial report for the third quarter of 2024
NIBE Q2'24: The bottom is reached
NIBE Industrier’s (publ) CEO and MD, Gerteric Lindquist, comments on first half year, 2024
NIBE Industriers (publ) – Interim report 2, 2024 (Q2)