Puuilo
12,9
EUR
-1 %
6.784 følger denne virksomhed
PUUILO
NASDAQ Helsinki
Retailers
Consumer Goods & Services
Overview
Finansielt overblik og estimater
Investor consensus
-1%
+2,87%
+29,91%
+26,22%
+43,09%
+22,04%
+150,49%
-
+77,69%
Puuilo operates in the retail industry. The company operates and manages a number of stores and trading venues. The range is wide and includes items within domestic and pet animals that are forwarded under own or other brands. The customers mainly consist of private actors worldwide, and the largest presence is in Finland.
Læs mereMarkedsværdi
1,09 mia. EUR
Aktieomsætning
2,69 mio. EUR
P/E (adj.) (25e)
20,44
EV/EBIT (adj.) (25e)
16,48
P/B (25e)
11,4
EV/S (25e)
2,75
Udbytteafkast, % (25e)
3,91 %

Omsætning og EBIT-margin
Omsætning mio.
EBIT-% (adj.)
EPS og udbytte
EPS (adj.)
Udbytte %
Finanskalender
10.6
2025
Selskabsgennemgang Q1'25
11.9
2025
Delårsrapport Q2'25
15.10
2025
Halvårligt udbytte
Risiko
Business risk
Valuation risk
Lav
Høj
Alle
Analyse
Selskabspræsentationer
Selskabsmeddelelser
ViserAlle indholdstyper
Resolutions of Puuilo Plc's Annual General Meeting and the constitutive meeting of the Board of Directors
CORRECTION: Puuilo Plc Notice to the Annual General Meeting 2025
Join Inderes community
Don't miss out - create an account and get all the possible benefits
Inderes account
Followings and notifications on followed companies
Analyst comments and recommendations
Stock comparison tool & other popular tools
Puuilo’s Annual Reporting 2024 has been published
Puuilo Plc: Board Of Directors established a new long-term incentive plan for company's key employees
Puuilo Plc: Notice to the annual general meeting
Puuilo Oyj - Managers' Transactions (Ranta)
Puuilo Oyj - Managers' Transactions (Saarela)
Change In The Holding of Puuilo Plc’s treasury shares

Puuilo Q4'24: Good momentum continues, but valuation is tight
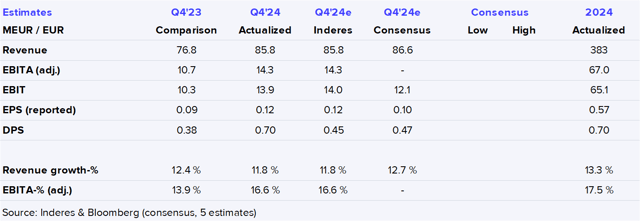
Puuilo Q4'24 flash comment: Expected guidance, shareholders rewarded with an additional dividend
Puuilo Plc, Financial Statements Release 2024: Record Year – net sales and EBITA continued to grow
Puuilo has signed a new € 100 million long-term financing agreement
Proposal of the Shareholders’ Nomination Board for the composition and remuneration of Puuilo’s Board of Directors
Puuilo Plc will publish its Financial statements release for the financial year 2024 on 27 March 2025
Tokmanni’s competitor Rusta grew strongly in its domestic market in Sweden