Scanfil
8,58
EUR
+0,94 %
5.384 følger denne virksomhed
SCANFL
NASDAQ Helsinki
Software
Technology
Overview
Finansielt overblik og estimater
Investor consensus
+0,94%
-4,88%
+4,13%
+4%
+13,64%
+5,41%
+21,88%
+101,88%
+1.014,29%
Scanfil is an international electronics contract manufacturer specializing in industrial and B2B customers. Its service offering includes manufacturing of end-products and components such as PCBs. Manufacturing services are the core of the company supported by design, supply chain, and modernization services. It operates globally in Europe, the Americas, and Asia. Customers are mainly companies operating in process automation, energy efficiency, green transition, and medical segments.
Læs mereMarkedsværdi
560,7 mio. EUR
Aktieomsætning
77,82 t EUR
P/E (adj.) (25e)
12,86
EV/EBIT (adj.) (25e)
9,72
P/B (25e)
1,75
EV/S (25e)
0,67
Udbytteafkast, % (25e)
2,91 %
Coverage

Head of Research
Omsætning og EBIT-margin
Omsætning mio.
EBIT-% (adj.)
EPS og udbytte
EPS (adj.)
Udbytte %
Finanskalender
24.4
2025
Delårsrapport Q1'25
25.4
2025
Generalforsamling '25
28.4
2025
Årligt udbytte
Risiko
Business risk
Valuation risk
Lav
Høj
Alle
Analyse
Selskabspræsentationer
Selskabsmeddelelser
Eksterne analyser
ViserAlle indholdstyper
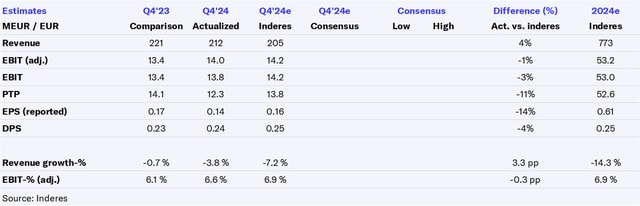
Scanfil Extensive Report: Topline-driven value creation
Contract manufacturer Kitron raised its guidance for the current year moderately
Join Inderes community
Don't miss out - create an account and get all the possible benefits
Inderes account
Followings and notifications on followed companies
Analyst comments and recommendations
Stock comparison tool & other popular tools
Carnegie Access: Scanfil: Time to put new orders won into work – Q1 preview
Scanfil Regional Segments Comparison Figures
Scanfil plc’s Annual Report 2024 was published
Notice of the Annual General Meeting of Scanfil plc
Correction: Share subscriptions based on Scanfil plc’s stock options
Share subscriptions based on Scanfil plc’s stock options
Scanfil signs agreement with Leardal Medical for Malaysian factory
Scanfil plc: Managers' transactions – Kosunen
Transfer of own shares as part of Scanfil plc’s stock option program 2019(B)
Scanfil plc: Managers' transactions – Valo
Scanfil plc: Managers' transactions – Valo
Scanfil plc: Managers' transactions – Valo
Scanfil plc: Managers' transactions – Kosunen

Scanfil Q4’24: No room for surprises
Scanfil Q4'24: Expected return determined by earnings growth
Carnegie Access: Scanfil: Fin(n)ishing off the year in solid fashion – Q4 update