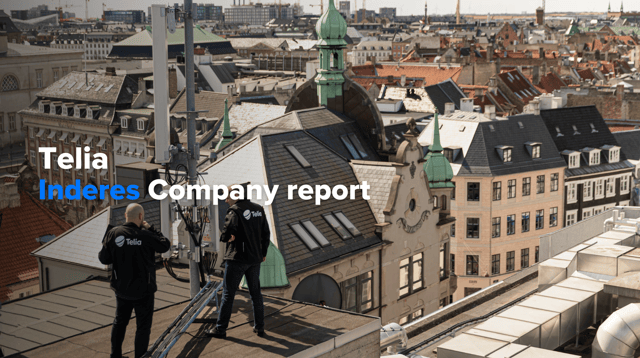
Telia Company
31.4
SEK
-0.16 %
TELIA
NASDAQ Stockholm
Telecommunications
Technology
13,198 following
-0.16%
+3.09%
-2.3%
+1.42%
+16.95%
+22.04%
+30.02%
-10.36%
-24.92%
-63.64%
www.teliacompany.com/sv/investerare
Telia Company is active in the telecom sector. The company delivers a wide range of services within voice, IP and capacity services, mainly through wholly-owned international carrier networks. The customers are found among private customers and corporate customers. Most of the business is done in the Nordic countries, the Baltics, and Europe. The company was formed by a merger of Telia and Sonera. The head office is located in Solna.
P/E (adj.) (24e)
17.42
EV/EBIT (adj.) (24e)
16.46
P/B (24e)
2.29
Dividend yield-% (24e)
6.37 %
Target price
32.00 SEK
Recommendation
Reduce
Updated
25.10.2024
NASDAQ Stockholm
TELIA
Daily low / high price
31.12 / 31.46
SEK
Market cap
123.47B SEK
Turnover
45.03M SEK
Volume
1.4M
Business risk
Valuation risk
Current
Previous
Latest research
Analyst
Joni Grönqvist
Analyst
Financial calendar
Annual report
30.01.2025
Quarterly dividend
06.02.2025
General meeting
09.04.2025
Interim report
24.04.2025
Interim report
18.07.2025
Major OwnersSource: Millistream Market Data AB
Owner | Capital | Votes |
---|---|---|
Swedish State | 41.1 % | 41.1 % |
BlackRock | 3.4 % | 3.4 % |
Vanguard | 2.4 % | 2.4 % |
Nordea Funds | 1.5 % | 1.5 % |
Handelsbanken Fonder | 1.4 % | 1.4 % |
Swedbank Robur funds | 1.3 % | 1.3 % |
Norges Bank | 1.1 % | 1.1 % |
Folksam | 1.0 % | 1.0 % |
Länsförsäkringar Fonder | 0.8 % | 0.8 % |
Avanza Funds | 0.8 % | 0.8 % |
Income statement
2020 | 2021 | 2022 | 2023 | 2024e | 2025e | 2026e | 2027e | |
---|---|---|---|---|---|---|---|---|
Revenue | 89,190.7 | 88,342.6 | 90,827.3 | 88,785.1 | 88,899.8 | 90,630.2 | 92,840.5 | 94,951.4 |
growth-% | 3.8 % | -1.0 % | 2.8 % | -2.2 % | 0.1 % | 1.9 % | 2.4 % | 2.3 % |
EBITDA | 30,193.5 | 35,151.0 | 29,417.3 | 28,392.0 | 29,516.6 | 31,883.6 | 32,378.8 | 33,195.1 |
EBIT (adj.) | 10,735.2 | 9,928.9 | 11,310.3 | 10,758.0 | 13,019.7 | 14,184.6 | 14,686.8 | 15,526.5 |
EBIT | 2,332.5 | 15,127.5 | -9,518.7 | 4,875.0 | 11,086.0 | 13,384.6 | 13,786.8 | 14,526.5 |
Profit before taxes | -21,065.5 | 12,597.5 | -12,782.7 | 1,105.0 | 7,373.5 | 10,044.6 | 10,273.4 | 10,773.7 |
Net income | -22,633.5 | 11,504.5 | -14,637.7 | -588.0 | 5,153.4 | 7,379.2 | 7,477.6 | 7,860.4 |
EPS (adj.) | 1.63 | 1.54 | 0.53 | 1.31 | 1.80 | 2.08 | 2.13 | 2.25 |
growth-% | -20.9 % | -5.3 % | -65.6 % | 147.5 % | 37.3 % | 15.4 % | 2.4 % | 5.8 % |
Dividend | 2.00 | 2.05 | 2.00 | 2.00 | 2.00 | 2.00 | 2.05 | 2.10 |
Dividend ratio | -36.1 % | 72.9 % | -53.7 % | -1,337.6 % | 152.6 % | 106.6 % | 107.8 % | 105.1 % |
Profitability and return on capital
2020 | 2021 | 2022 | 2023 | 2024e | 2025e | 2026e | 2027e | |
---|---|---|---|---|---|---|---|---|
EBITDA-% | 33.9 % | 39.8 % | 32.4 % | 32.0 % | 33.2 % | 35.2 % | 34.9 % | 35.0 % |
EBIT-% (adj.) | 12.0 % | 11.2 % | 12.5 % | 12.1 % | 14.6 % | 15.7 % | 15.8 % | 16.4 % |
EBIT-% | 2.6 % | 17.1 % | -10.5 % | 5.5 % | 12.5 % | 14.8 % | 14.8 % | 15.3 % |
ROE | -29.4 % | 16.0 % | -20.2 % | -1.0 % | 9.6 % | 13.7 % | 14.0 % | 16.4 % |
ROI | -10.5 % | 9.9 % | -5.8 % | 3.3 % | 7.6 % | 9.4 % | 9.7 % | 10.2 % |
Valuation
2020 | 2021 | 2022 | 2023 | 2024e | 2025e | 2026e | 2027e | |
---|---|---|---|---|---|---|---|---|
Share price (SEK) | 33.96 | 35.41 | 26.66 | 25.73 | 31.40 | 31.40 | 31.40 | 31.40 |
Shares | 4,089.6 | 4,089.6 | 3,932.1 | 3,932.1 | 3,932.1 | 3,932.1 | 3,932.1 | 3,932.1 |
Market cap | 138,883.8 | 144,793.4 | 104,830.1 | 101,173.2 | 123,468.3 | 123,468.3 | 123,468.3 | 123,468.3 |
Enterprise value | 223,552.8 | 217,034.4 | 194,448.1 | 191,731.2 | 214,241.5 | 214,958.3 | 215,542.4 | 215,966.0 |
EV/S | 2.5 | 2.5 | 2.1 | 2.2 | 2.4 | 2.4 | 2.3 | 2.3 |
EV/EBITDA | 7.4 | 6.2 | 6.6 | 6.8 | 7.3 | 6.7 | 6.7 | 6.5 |
EV/EBIT (adj.) | 20.8 | 21.9 | 17.2 | 17.8 | 16.5 | 15.2 | 14.7 | 13.9 |
EV/EBIT | 95.8 | 14.3 | - | 39.3 | 19.3 | 16.1 | 15.6 | 14.9 |
P/E (adj.) | 20.9 | 23.0 | 50.3 | 19.6 | 17.4 | 15.1 | 14.7 | 13.9 |
P/E | - | 12.6 | - | - | 24.0 | 16.7 | 16.5 | 15.7 |
P/B | 2.2 | 1.8 | 1.6 | 1.9 | 2.3 | 2.3 | 2.3 | 2.9 |
P/S | 1.6 | 1.6 | 1.2 | 1.1 | 1.4 | 1.4 | 1.3 | 1.3 |
Dividend yield | 5.9 % | 5.8 % | 7.5 % | 7.8 % | 6.4 % | 6.4 % | 6.5 % | 6.7 % |
Equity ratio | 28.2 % | 35.2 % | 30.4 % | 25.2 % | 27.3 % | 27.0 % | 26.7 % | 21.8 % |
Gearing ratio | 120.4 % | 75.2 % | 118.1 % | 141.7 % | 140.7 % | 143.2 % | 145.2 % | 199.3 % |
Quarter data
Q4/23 | 2023 | Q1/24 | Q2/24 | Q3/24 | Q4/24e | 2024e | Q1/25e | Q2/25e | |
---|---|---|---|---|---|---|---|---|---|
Revenue | 23,098.9 | 88,785.1 | 21,274.1 | 22,379.6 | 21,749.0 | 23,497.1 | 88,899.8 | 21,808.1 | 22,682.5 |
EBITDA | 6,737.3 | 28,392.0 | 6,753.0 | 7,607.2 | 8,462.7 | 6,693.8 | 29,516.6 | 7,418.4 | 7,897.7 |
EBIT | -2,428.2 | 4,875.0 | 2,247.0 | 2,923.2 | 3,882.1 | 2,033.8 | 11,086.0 | 2,793.7 | 3,272.9 |
Profit before taxes | -3,300.2 | 1,105.0 | 1,023.0 | 2,002.5 | 3,137.8 | 1,210.2 | 7,373.5 | 1,893.7 | 2,392.9 |
Net income | -3,296.2 | -588.0 | 586.0 | 1,434.5 | 2,324.8 | 808.2 | 5,153.4 | 1,349.7 | 1,749.1 |
ShowingAll content types
Telia Q3'24: We still await evidence of efficiency measures
Telia Company Interim Report January - September 2024
Join Inderes community
Don't miss out - create an account and get all the possible benefits
Inderes account
Followings and notifications on followed companies
Analyst comments and recommendations
Stock comparison tool & other popular tools