Lindex Group
2.895
EUR
-0.86 %
6,813 following
LINDEX
NASDAQ Helsinki
Personal Goods
Consumer Goods & Services
Overview
Financials & Estimates
Investor consensus
-0.86%
-6.61%
+8.22%
+7.62%
+1.05%
-11.47%
+64.68%
+292.81%
-80.67%
Lindex Group operates in the retail industry. The Group manages a number of stores around larger shopping centers and commercial premises located in the Nordic market. The Group is a reseller of several brands and the range consists of shoes and associated accessories. The company is headquartered in Helsinki.
Read moreMarket cap
468.22M EUR
Turnover
586.17K EUR
P/E (adj.) (24e)
21.14
EV/EBIT (adj.) (24e)
14.96
P/B (24e)
1.18
EV/S (24e)
1.11
Dividend yield-% (24e)
-
Coverage
Revenue and EBIT-%
Revenue M
EBIT-% (adj.)
EPS and dividend
EPS (adj.)
Dividend %
Financial calendar
29.4
2025
Interim report Q1'25
18.7
2025
Interim report Q2'25
24.10
2025
Interim report Q3'25
Risk
Business risk
Valuation risk
Low
High
All
Research
Webcasts
Press releases
ShowingAll content types
Lindex Group, Webcast, Q1'25
Lindex Group Oyj: The Board of Directors of Lindex Group plc has resolved on a directed share issue without consideration for the delivery of the long-term incentive scheme rewards
Join Inderes community
Don't miss out - create an account and get all the possible benefits
Inderes account
Followings and notifications on followed companies
Analyst comments and recommendations
Stock comparison tool & other popular tools
Lindex Group Oyj: Decisions by Lindex Group plc's Annual General Meeting and the organizational meeting of the Board of Directors
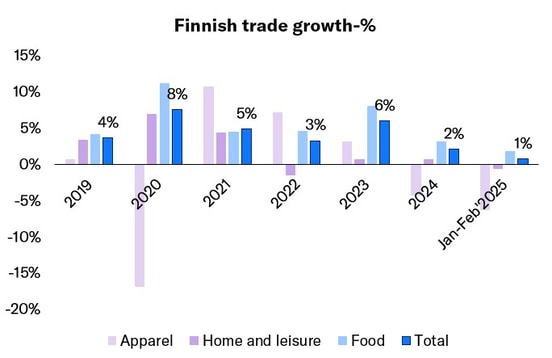
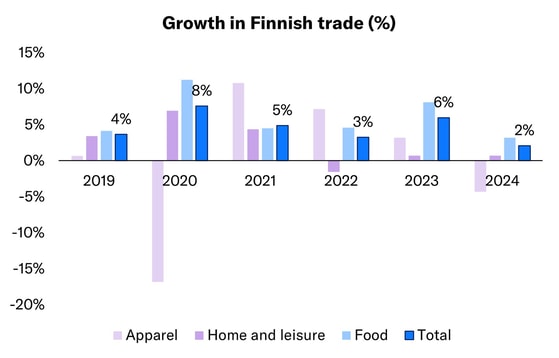
Finnish trade down in February
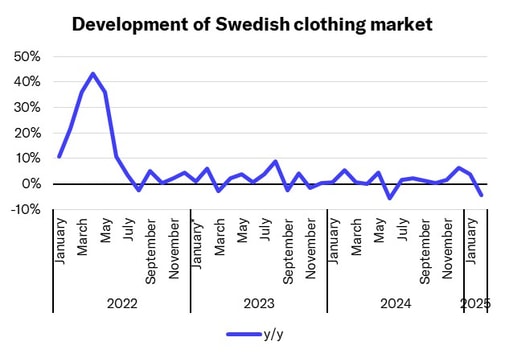
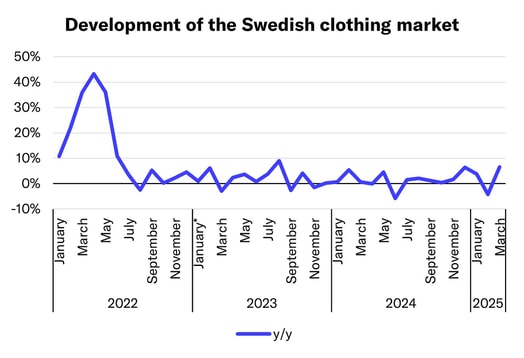
Lindex Group: The Swedish clothing market decreased in February
Lindex Group Oyj: Lindex Group's Annual Report and Remuneration Report for 2024 have been published
Lindex Group Oyj: Share-based long-term incentive scheme for the key management of Lindex Group and its divisions
Lindex Group Oyj: Notice to Lindex Group plc's Annual General Meeting
Growth trend in Finnish trade in January followed last year's pattern
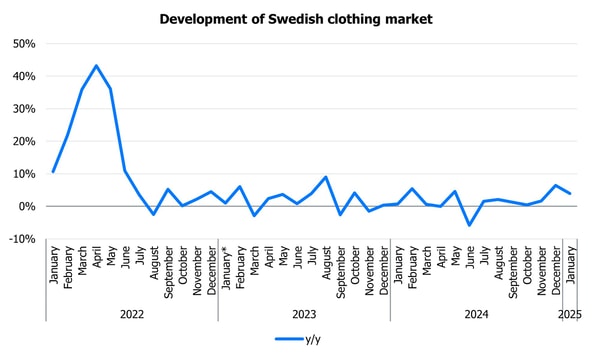
Lindex Group: Swedish clothing market continued to grow in January
Lindex Q4’24: Still waiting for results from strategic review
Lindex Q4'24: Strong end to the year and positive outlook
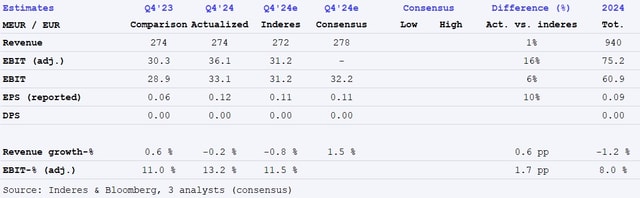
Lindex Group Q4’24 flash comment: Strong result and guidance in line with expectations

Lindex Group, Webcast, Q4'24
Lindex Group Oyj: Lindex Group's Financial Statements Bulletin 2024
Lindex Group Oyj: Lindex Group plans to close Stockmann Itis department store in Helsinki

Lindex Q4'24 preview: End of year seems to have gone relatively well