Starbreeze
0.185
SEK
-2.53 %
Less than 1K followers
STAR B
NASDAQ Stockholm
Software
Technology
Overview
Financials & Estimates
Ownership
Investor consensus
-2.53%
+1.37%
-5.13%
-11.74%
-25.76%
-3.34%
-79.15%
-80.34%
-98.28%
Starbreeze operates in the gaming industry and focuses on the development, publishing and distribution of computer games and interactive entertainment. The company's portfolio includes both its own games and collaborations with other game developers. The business is aimed at gamers and distributors globally, with the largest operations in Europe. Starbreeze was founded in 1998 and is headquartered in Stockholm, Sweden.
Read moreMarket cap
273.2M SEK
Turnover
79.68K SEK
P/E (adj.) (25e)
60.39
EV/EBIT (adj.) (25e)
25.16
P/B (25e)
0.38
EV/S (25e)
0.48
Dividend yield-% (25e)
-
Coverage


Revenue and EBIT-%
Revenue M
EBIT-% (adj.)
EPS and dividend
EPS (adj.)
Dividend %
Financial calendar
13.5
2025
Interim report Q1'25
15.5
2025
General meeting '25
Risk
Business risk
Valuation risk
Low
High
All
Research
Webcasts
Press releases
ShowingAll content types
Notice of Annual General Meeting in Starbreeze AB (publ)
Starbreeze, Webcast, Q1'25
Join Inderes community
Don't miss out - create an account and get all the possible benefits
Inderes account
Followings and notifications on followed companies
Analyst comments and recommendations
Stock comparison tool & other popular tools
Starbreeze AB (publ) postpones publication of Annual Report 2024 until April 15
Starbreeze: New CEO appointed
Adolf Kristjansson appointed as new CEO of Starbreeze
‘Out of Sight’ to be released on May 22, 2025
Roboquest Physical Pre-orders for PlayStation®5 Start Today!
Change in the number of shares and votes in Starbreeze AB
Redeye: Starbreeze - Cash postive agreements with optionality

Starbreeze Q4'24: Low expectations presents opportunities
Starbreeze, Webcast, Q4'24
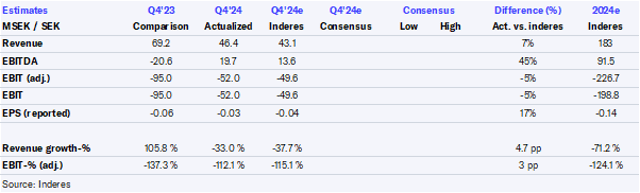
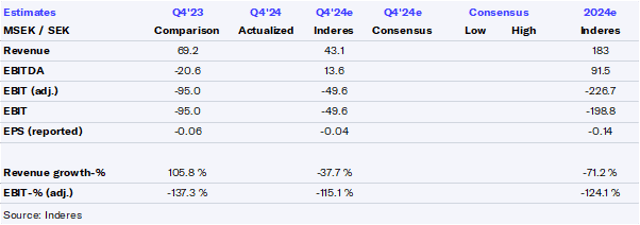
Starbreeze Q4’24 flash comment: PD3 revenue clearly below our expectations
Starbreeze AB (publ) Full-Year 2024
Invitation to investor presentation – Full-year 2024