Digia
6,5
EUR
-2,4 %
7.268 følger denne virksomhed
DIGIA
NASDAQ Helsinki
IT Services
Technology
Overview
Finansielt overblik og estimater
Investor consensus
-2,4%
-5,8%
-0,31%
-2,4%
+16,91%
+22,64%
-12,04%
+49,43%
+49,71%
Digia is an IT consulting company. The company specializes in system integration, web analysis, and internal processes that concern efficiency and decision management. The company's services are used in a number of sectors, from the financial sector to the grocery trade and the energy sector. The largest presence in the Nordic domestic market. Digia is headquartered in Helsinki.
Læs mereMarkedsværdi
174,35 mio. EUR
Aktieomsætning
17,5 t EUR
P/E (adj.) (25e)
10,36
EV/EBIT (adj.) (25e)
7,87
EV/S (25e)
0,82
Udbytteafkast, % (25e)
2,92 %

Latest research
Seneste analyse
Released: 09.02.2022
Omsætning og EBIT-margin
Omsætning mio.
EBIT-% (adj.)
EPS og udbytte
EPS (adj.)
Udbytte %
Finanskalender
25.4
2025
Selskabsgennemgang Q1'25
7.8
2025
Delårsrapport Q2'25
23.10
2025
Selskabsgennemgang Q3'25
Risiko
Business risk
Valuation risk
Lav
Høj
Alle
Analyse
Selskabsmeddelelser
Eksterne analyser
ViserAlle indholdstyper
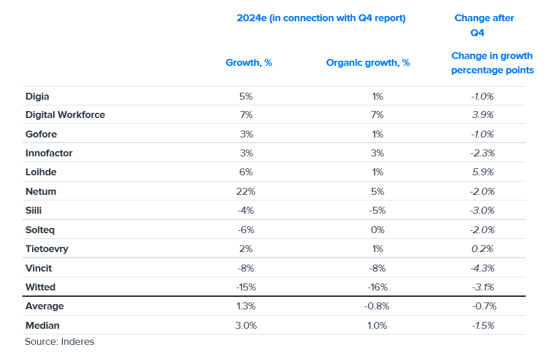
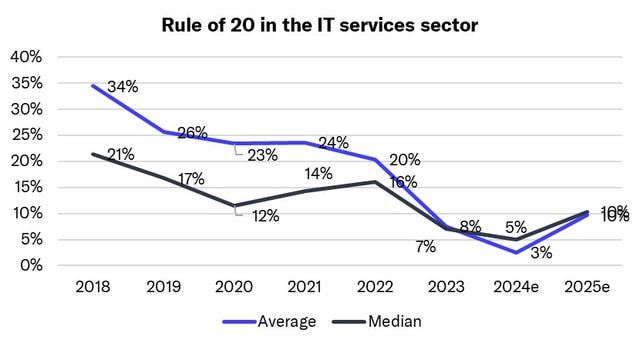
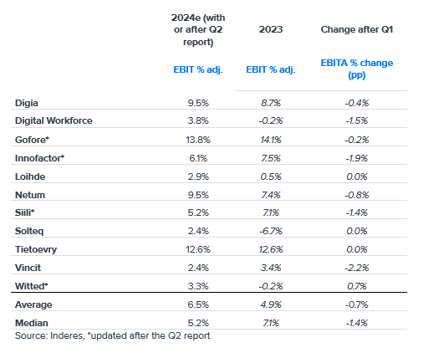
Outlook for the IT service sector 2025: Growth will kick off again at the end of the year
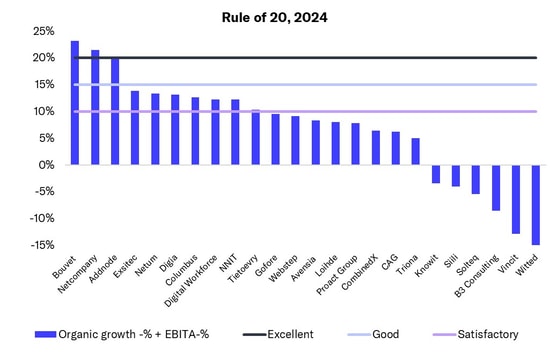
In the IT service sector, a few Nordic companies achieved excellent performance measured by the 'Rule of 20'
Join Inderes community
Don't miss out - create an account and get all the possible benefits
Inderes account
Followings and notifications on followed companies
Analyst comments and recommendations
Stock comparison tool & other popular tools
IT service sector: Q4 was tough, as was 2024
Digia Oyj: Digia Plc's annual reporting package 2024 published
Digia Oyj: Notice of Digia Plc's Annual General Meeting 2025
Digia Oyj: Digia Plc Financial Statement Bulletin 2024 (unaudited)
Introducing the Rule of 20: The best measure for IT services performance signals market softening
IT service sector: Bottom of cycle passed, grain will be separated from chaff in 2025
Q3 IT service sector summary: Revenue down but profitability up – sector shows clear divide
Digia Oyj: VSV Group in the energy sector seeks efficiency by renewing its ERP - Digia becomes a partner
Digia Oyj: Traficom chooses Digia as its integration partner - its position in the transport sector will be strengthened
Digia Oyj: Digia selected as NATO's framework agreement supplier - there is international demand for Finnish IT expertise in the defence and security sector
Digia Oyj: Digia Plc Business Review January-September 2024 (unaudited)
IT service sector: Market performance in Denmark and Norway better than in Finland and Sweden
IT services sector 2024 expectations fell slightly in Q2, but H2 looks a little better
Digia Oyj: Digia's Financial Calendar and Annual General Meeting in 2025
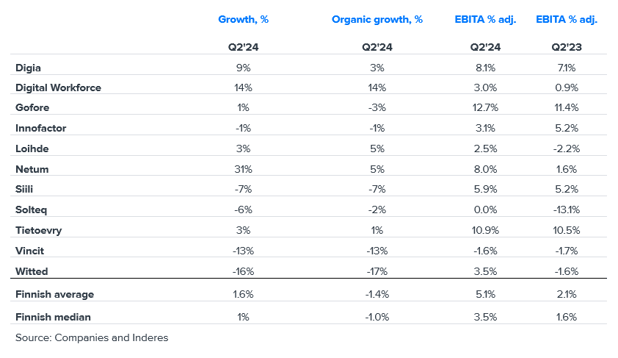
Q2 IT service sector summary: Slightly steeper revenue decline, improved profitability and signs of demand bottoming out
Digia Oyj: Digia Plc's Half-year Financial Report January-June 2024 (unaudited)