Solteq
0,676
EUR
+1,81 %
6.050 følger denne virksomhed
SOLTEQ
NASDAQ Helsinki
IT Services
Technology
Overview
Finansielt overblik og estimater
Investor consensus
+1,81%
-5,32%
+9,03%
+10,82%
+3,05%
-3,15%
-78,37%
-32,06%
-86,56%
Solteq is an IT consulting company. The company specializes in ERP - Enterprise Resource Planning. Other services offered are related to financial management and inventory management. The customers consist of small and medium-sized corporate customers active in the retail and hotel industry. Solteq operates worldwide, with the largest presence in Europe, North America, and Asia.
Læs mereMarkedsværdi
13,11 mio. EUR
Aktieomsætning
2,58 t EUR
P/E (adj.) (25e)
-104,31
EV/EBIT (adj.) (25e)
13,44
EV/S (25e)
0,69
Udbytteafkast, % (25e)
-

Omsætning og EBIT-margin
Omsætning mio.
EBIT-% (adj.)
EPS og udbytte
EPS (adj.)
Udbytte %
Finanskalender
29.4
2025
Delårsrapport Q1'25
21.8
2025
Delårsrapport Q2'25
29.10
2025
Delårsrapport Q3'25
Risiko
Business risk
Valuation risk
Lav
Høj
Alle
Analyse
Selskabspræsentationer
Selskabsmeddelelser
Eksterne analyser
ViserAlle indholdstyper
Solteq Plc: Decisions of the Annual General Meeting 2025 and the Board of Directors' organizing meeting
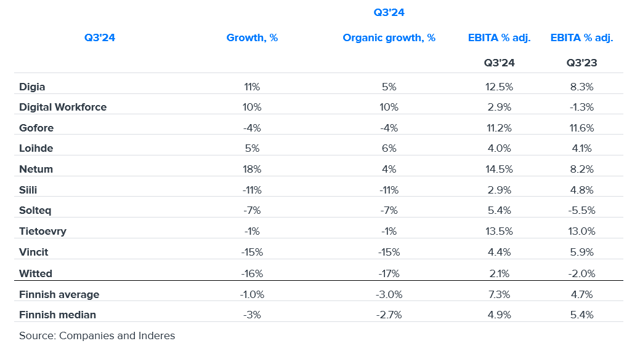
Outlook for the IT service sector 2025: Growth will kick off again at the end of the year
Join Inderes community
Don't miss out - create an account and get all the possible benefits
Inderes account
Followings and notifications on followed companies
Analyst comments and recommendations
Stock comparison tool & other popular tools
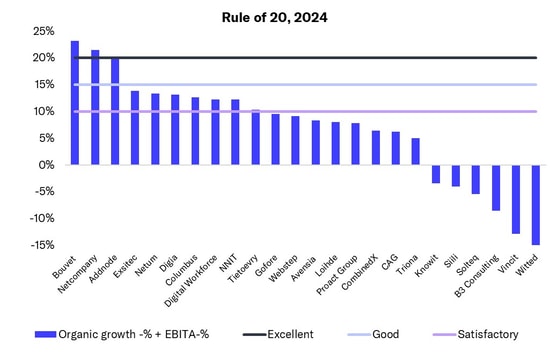
In the IT service sector, a few Nordic companies achieved excellent performance measured by the 'Rule of 20'
Solteq Plc - Managers' Transactions
Solteq: Repurchase and Cancellation of Bond Notes
IT service sector: Q4 was tough, as was 2024
Solteq Plc - Managers' Transactions
Notice to Solteq Plc's Annual General Meeting 2025
Solteq Plc's Annual Report 2024 Has Been Published
Solteq Plc's Financial Statements Bulletin January 1 - December 31, 2024
The proposals of Solteq Plc's Shareholders' Nomination Committee for the 2025 Annual General Meeting
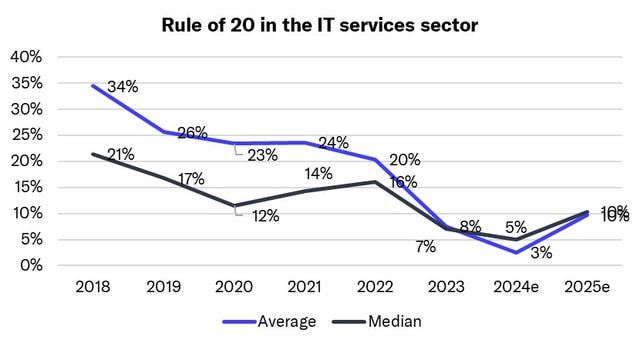
Introducing the Rule of 20: The best measure for IT services performance signals market softening
Solteq: Repurchase and Cancellation of Bond Notes
Solteq Plc - Managers' Transactions
Solteq Plc - Managers' Transactions
IT service sector: Bottom of cycle passed, grain will be separated from chaff in 2025
Changes in Solteq Plc's Executive Team