Vincit
1,655
EUR
0 %
8.081 følger denne virksomhed
VINCIT
First North Finland
Software
Technology
Overview
Finansielt overblik og estimater
Investor consensus
0%
-8,06%
-4,06%
-3,78%
-19,27%
-38,93%
-70,91%
-60,6%
-72,87%
Vincit provides services in design and software development. The services include, for example, software for e-commerce and web applications, cloud platforms, mobile applications and IoT solutions. The services are used by both small and medium-sized corporate customers. The main operations are in Europe and North America. Vincit was founded in 2007 and is headquartered in Finland.
Læs mereMarkedsværdi
28,06 mio. EUR
Aktieomsætning
45,77 t EUR
P/E (adj.) (25e)
14,11
EV/EBIT (adj.) (25e)
7,47
EV/S (25e)
0,25
Udbytteafkast, % (25e)
7,25 %
Omsætning og EBIT-margin
Omsætning mio.
EBIT-% (adj.)
EPS og udbytte
EPS (adj.)
Udbytte %
Finanskalender
17.7
2025
Delårsrapport Q2'25
23.10
2025
Delårsrapport Q3'25
Risiko
Business risk
Valuation risk
Lav
Høj
Alle
Analyse
Selskabsmeddelelser
ViserAlle indholdstyper
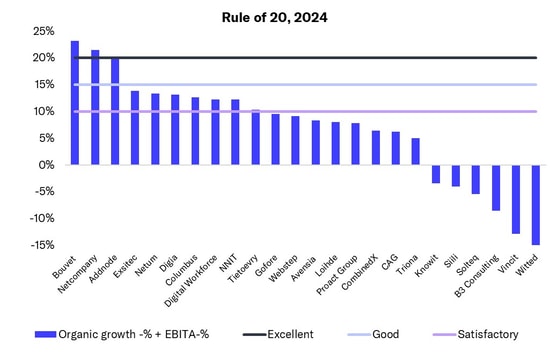
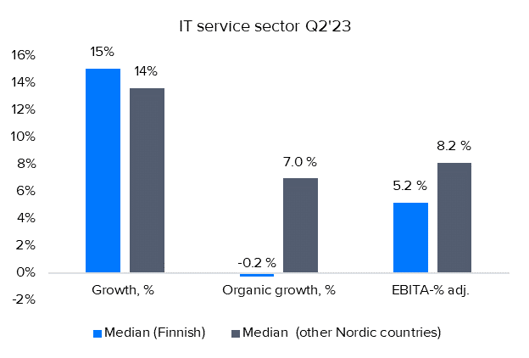
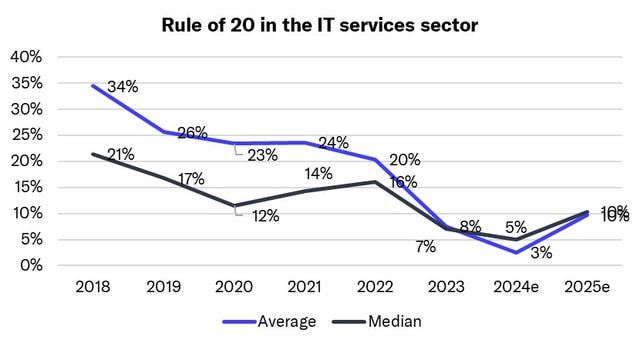
In the IT service sector, a few Nordic companies achieved excellent performance measured by the 'Rule of 20'
IT service sector: Q4 was tough, as was 2024
Join Inderes community
Don't miss out - create an account and get all the possible benefits
Inderes account
Followings and notifications on followed companies
Analyst comments and recommendations
Stock comparison tool & other popular tools
Introducing the Rule of 20: The best measure for IT services performance signals market softening
IT service sector: Bottom of cycle passed, grain will be separated from chaff in 2025
Q3 IT service sector summary: Revenue down but profitability up – sector shows clear divide
IT service sector: Market performance in Denmark and Norway better than in Finland and Sweden
IT services sector 2024 expectations fell slightly in Q2, but H2 looks a little better
Q2 IT service sector summary: Slightly steeper revenue decline, improved profitability and signs of demand bottoming out
IT services sector's 2024 expectations fell slightly in Q1 - revenue expected to remain flat and profitability to rise slightly
IT service sector Q1 summary: Revenue and profitability down from a strong comparison period, but some defensive wins in profitability as well
IT service sector: Our expectations for 2024 generally at the lower end of companies' guidance

Q4 IT service sector summary: Growth and profitability in line with our expectations, 2023 can be seen as a defensive win
IT service sector valuation levels at the bottom of our 7-year monitoring history, justifiably?
We expect the IT services sector to grow moderately and profitability to increase slightly in 2024
IT services sector Q3 summary: Better than feared with several areas continuing to perform well