Innofactor
1.69
EUR
-0.59 %
IFA1V
NASDAQ Helsinki
Software
Technology
6,022 following
-0.59%
+0.3%
-0.29%
+0.6%
+2.11%
+47.6%
+24.72%
+125.33%
-99.35%
Innofactor operates in the IT sector. The company is focused on offering services in digitization and cloud-based solutions. Examples of business areas include sales, marketing and communication, business intelligence, and CRM (Customer Relationship Management). The largest presence is found in the Nordic market and customers consist of small and medium-sized corporate customers. The head office is located in Espoo.
Read moreMarket cap
60.48M EUR
Turnover
8.19K EUR
Revenue
80.26M
EBIT %
7.28 %
P/E
17.98
Dividend yield-%
-
Financial calendar
28.2
2025
Annual report '24
25.6
2025
General meeting '25
30.9
2025
Interim report Q2'25
ShowingAll content types
Innofactor wins contract to provide the case and document management system for a leading Swedish technical university
Trustee appointed for the arbitration proceedings concerning the redemption of minority shares in Innofactor Plc
Join Inderes community
Don't miss out - create an account and get all the possible benefits
Inderes account
Followings and notifications on followed companies
Analyst comments and recommendations
Stock comparison tool & other popular tools
Innofactor: Our coverage ends due to delisting
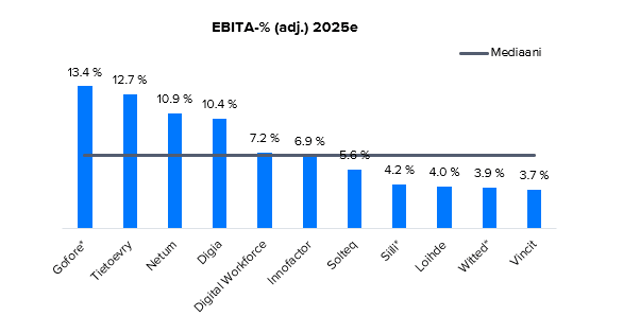
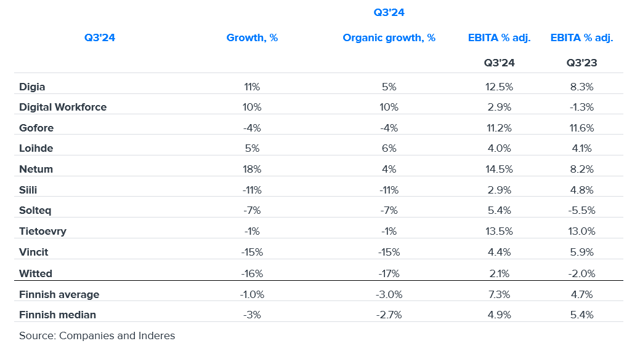
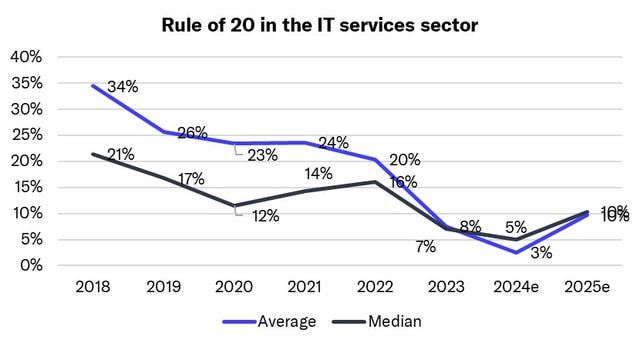
IT service sector: Bottom of cycle passed, grain will be separated from chaff in 2025
Innofactor Plc: Cancellation of treasury shares registered in the trade register
Change to the date of Innofactor Plc’s Annual General Meeting in 2025
Anni Wahlroos appointed Innofactor’s Deputy CEO
Onni Bidco Oy to commence redemption proceedings in respect of the remaining minority shares in Innofactor Plc