Solteq
0.676
EUR
+1.81 %
6,050 following
SOLTEQ
NASDAQ Helsinki
IT Services
Technology
Overview
Financials & Estimates
Investor consensus
+1.81%
-5.32%
+9.03%
+10.82%
+3.05%
-3.15%
-78.37%
-32.06%
-86.56%
Solteq is an IT consulting company. The company specializes in ERP - Enterprise Resource Planning. Other services offered are related to financial management and inventory management. The customers consist of small and medium-sized corporate customers active in the retail and hotel industry. Solteq operates worldwide, with the largest presence in Europe, North America, and Asia.
Read moreMarket cap
13.11M EUR
Turnover
2.58K EUR
P/E (adj.) (25e)
-104.31
EV/EBIT (adj.) (25e)
13.44
EV/S (25e)
0.69
Dividend yield-% (25e)
-

Revenue and EBIT-%
Revenue M
EBIT-% (adj.)
EPS and dividend
EPS (adj.)
Dividend %
Financial calendar
29.4
2025
Interim report Q1'25
21.8
2025
Interim report Q2'25
29.10
2025
Interim report Q3'25
Risk
Business risk
Valuation risk
Low
High
All
Research
Webcasts
Press releases
3rd party
ShowingAll content types
Solteq Plc: Decisions of the Annual General Meeting 2025 and the Board of Directors' organizing meeting
Outlook for the IT service sector 2025: Growth will kick off again at the end of the year
Join Inderes community
Don't miss out - create an account and get all the possible benefits
Inderes account
Followings and notifications on followed companies
Analyst comments and recommendations
Stock comparison tool & other popular tools
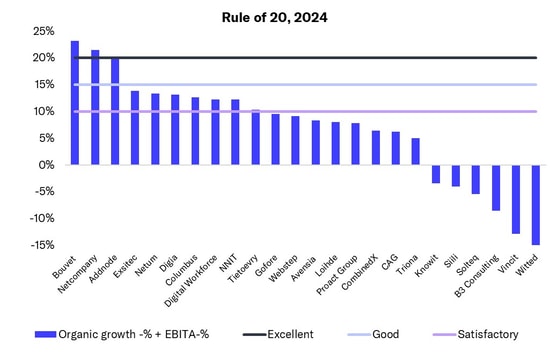
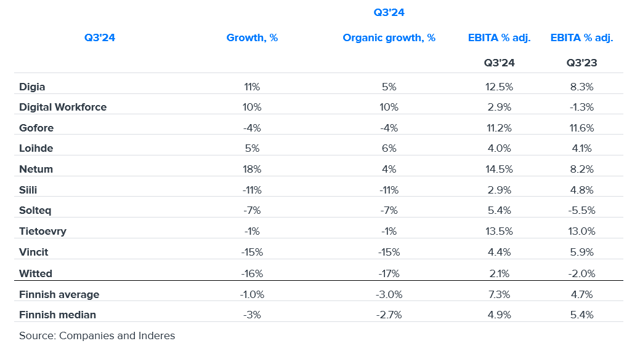
In the IT service sector, a few Nordic companies achieved excellent performance measured by the 'Rule of 20'
Solteq Plc - Managers' Transactions
Solteq: Repurchase and Cancellation of Bond Notes
IT service sector: Q4 was tough, as was 2024
Solteq Plc - Managers' Transactions
Notice to Solteq Plc's Annual General Meeting 2025
Solteq Plc's Annual Report 2024 Has Been Published
Solteq Plc's Financial Statements Bulletin January 1 - December 31, 2024
The proposals of Solteq Plc's Shareholders' Nomination Committee for the 2025 Annual General Meeting
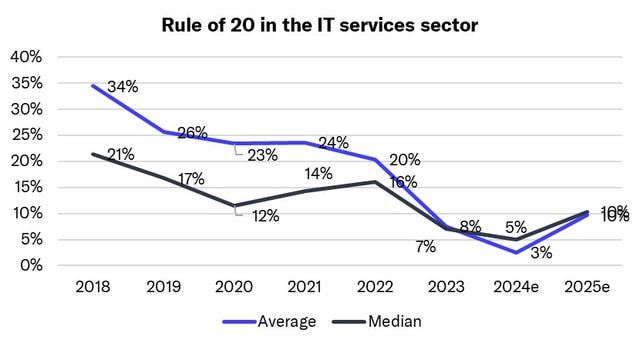
Introducing the Rule of 20: The best measure for IT services performance signals market softening
Solteq: Repurchase and Cancellation of Bond Notes
Solteq Plc - Managers' Transactions
Solteq Plc - Managers' Transactions
IT service sector: Bottom of cycle passed, grain will be separated from chaff in 2025
Changes in Solteq Plc's Executive Team