Siili Solutions
6.3
EUR
-0.32 %
7,830 following
SIILI
NASDAQ Helsinki
Software
Technology
Overview
Financials & Estimates
Investor consensus
-0.32%
+9.76%
+7.51%
+11.31%
+10.53%
-22.41%
-56.85%
-27.59%
+145.45%
Siili Solutions is a provider in the IT sector. The company develops and integrates software for information systems and offers services related to the development of technology platforms, information management, IT architecture, and various project management. The competence is found in data management, analysis, and artificial intelligence. Siili Solutions was founded in 2005 and is headquartered in Helsinki.
Read moreMarket cap
51.28M EUR
Turnover
24.82K EUR
P/E (adj.) (25e)
11.23
EV/EBIT (adj.) (25e)
7.77
EV/S (25e)
0.42
Dividend yield-% (25e)
3.17 %

Revenue and EBIT-%
Revenue M
EBIT-% (adj.)
EPS and dividend
EPS (adj.)
Dividend %
Financial calendar
12.8
2025
Interim report Q2'25
21.10
2025
Business review Q3'25
Risk
Business risk
Valuation risk
Low
High
All
Research
Webcasts
Press releases
ShowingAll content types
Siili Solutions Plc - Managers' transactions - Pienimäki
Siili Solutions Plc - Managers' transactions - Kankainen
Join Inderes community
Don't miss out - create an account and get all the possible benefits
Inderes account
Followings and notifications on followed companies
Analyst comments and recommendations
Stock comparison tool & other popular tools
Siili Solutions Plc - Managers' transactions - Niiniharju
Siili Solutions Plc - Managers' transactions - Salo
Siili Solutions Plc - Managers' transactions - Pienimäki
Siili Solutions Plc - Managers' transactions - Kankainen
Disposal of own shares based on performance share plan of Siili Solutions Plc
Share subscription price and market value of the Siili Solutions Plc stock options 2025A
Correction to stock exchange release: Siili Solutions Plc: Business review, 1 January – 31 March 2025
Siili Solutions Plc, Business review, 1 January–31 March 2025
Siili Solutions Plc: Resolutions of the Annual General Meeting and Board of Directors
Outlook for the IT service sector 2025: Growth will kick off again at the end of the year
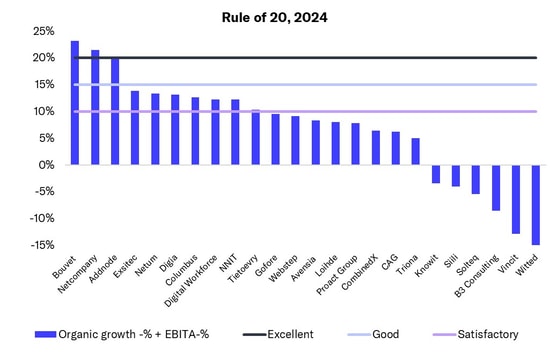
In the IT service sector, a few Nordic companies achieved excellent performance measured by the 'Rule of 20'