Loihde
12.4
EUR
+0.81 %
1,242 following
LOIHDE
First North Finland
IT Services
Technology
Overview
Financials & Estimates
Investor consensus
+0.81%
-0.8%
+15.35%
+3.33%
+13.76%
-9.16%
-19.74%
-
-45.49%
Loihde is a service company for digital development and security. Among other things, it offers solutions in data analysis and data management, user experience design, software development, cloud services and services in cyber security and security technology. The customers consist of business customers operating in a number of different sectors. The largest operations are found in Finland and Sweden.
Read moreMarket cap
71.07M EUR
Turnover
19.97K EUR
P/E (adj.) (25e)
19.43
EV/EBIT (adj.) (25e)
14.16
EV/S (25e)
0.54
Dividend yield-% (25e)
4.76 %
Coverage


Latest research
Latest analysis report
Released: 02.11.2022
Revenue and EBIT-%
Revenue M
EBIT-% (adj.)
EPS and dividend
EPS (adj.)
Dividend %
Financial calendar
30.4
2025
Business review Q1'25
8.5
2025
General meeting '25
9.5
2025
Annual dividend
Risk
Business risk
Valuation risk
Low
High
All
Research
Webcasts
Press releases
ShowingAll content types
Loihde Plc: Managers’ Transactions – Konttinen
Loihde Plc: Managers’ Transactions – Ahola
Join Inderes community
Don't miss out - create an account and get all the possible benefits
Inderes account
Followings and notifications on followed companies
Analyst comments and recommendations
Stock comparison tool & other popular tools
Loihde Plc: Managers’ Transactions – Järvinen
Loihde Plc: Managers’ Transactions – Teutari
Loihde Plc: Managers’ Transactions – Suhonen
Loihde Plc: Managers’ Transactions – Meronen

Outlook for the IT service sector 2025: Growth will kick off again at the end of the year
Loihde Plc: Managers’ Transactions – Teutari
Loihde Plc: Managers’ Transactions – Suhonen
Loihde Plc: Managers’ Transactions – Järvinen
Loihde Plc: Managers’ Transactions – Ahola
Loihde Plc: Managers’ Transactions – Meronen
Loihde’s Annual Report for 2024 has been published
Notice of Loihde Plc’s annual general meeting
Loihde Plc cancels treasury shares
Loihde Plc's Board of Directors decided on directed share issues as part of the share-based incentive schemes for employees and management
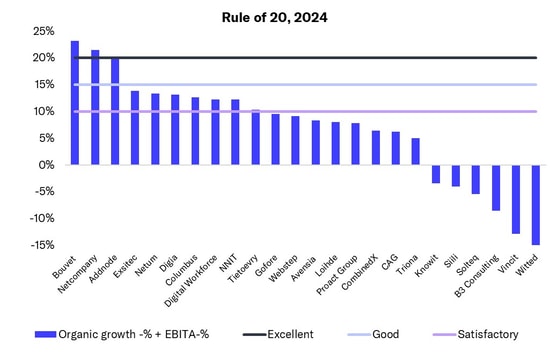
In the IT service sector, a few Nordic companies achieved excellent performance measured by the 'Rule of 20'